

The Component Performance Detail tab in the Server Console lets you view the following performance statistics about running lab members:
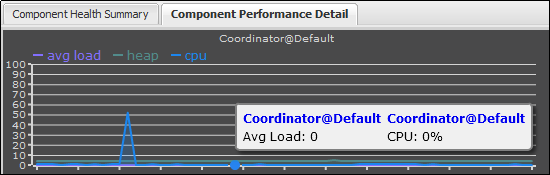
The following image contains performance data for a coordinator in the Default lab. Tooltips for the average load and CPU metrics are shown.
To view the component performance detail:
The lab member is added to the Component Performance Detail tab. The metrics appear with different colors. Each metric provides a tooltip.
|
Copyright © 2014 CA Technologies.
All rights reserved.
|
|