

The Component Health Summary tab in the Server Console provides an indicator of the overall health of running components.
The health indicator appears on a scale from 0 through 100. The value is derived from the following statistics:
A value of 0 represents an idle system. A value of 100 represents a system that is maxed out.
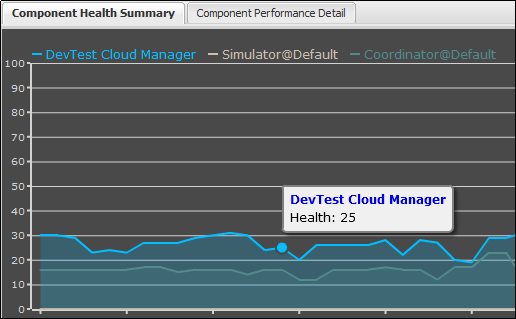
The following image shows the Component Health Summary tab. The X-axis represents the time. The Y-axis represents the value of the health indicator.
To view the component health summary:
The data appears in the Component Health Summary tab.
|
Copyright © 2014 CA Technologies.
All rights reserved.
|
|