

Session viewing lets a VSE user actually see the behavior of current (or recent) sessions on a VSE server. The user can determine why the response for a specific request was given. Session viewing also enables a live comparison between the responses that VSE provides and a corresponding live system. Where differences exist, the application can use model healing to patch or heal the VSE service image to keep it in sync with the live system.
Session viewing is only available for virtual services that run with an Execution Mode of Transaction Tracking or Image Validation. Model healing is only available for virtual services that run in Image Validation mode. For more information about execution modes, see Specify How the Selected Model Should Behave.
Model healing differs from learning because learning changes a service image immediately when CA Service Virtualization and live response differences are detected. Healing logs those differences for later review and application to the service image with the View Session and Tracking information panel.
You can manage session viewing and model healing with a panel that is accessible from either the VSE dashboard or while editing a virtual service model.
To view the session tracking for a selected virtual service, from the VSE Console Services tab, select a service and click Session/Tracking Information ![]() .
.
When you click the icon, the session panel opens to show the recorded session and transactions. If a deployed virtual service has no recorded transactions, the session panel opens with no session information.
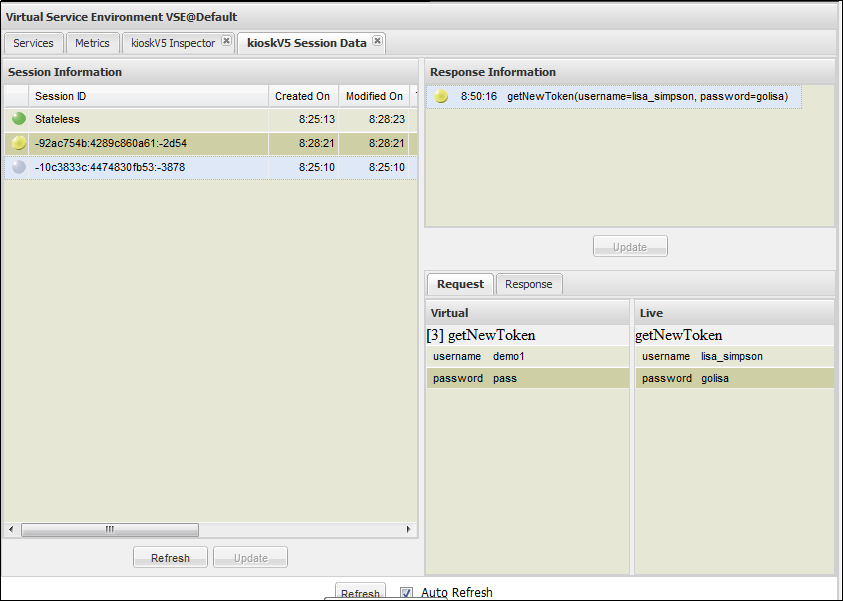
The session panel is divided into two panes: Session Information and Response Information.
Session Information Pane
The Session Information pane lists all the sessions for the selected virtual service in tabular format. To reorder the table or to select or clear the columns that show, click the arrow at the right of each column heading.
Displays and icon to indicate the current session status.
A gray ball indicates a session that was recorded in Transaction Tracking mode, or a session that has been healed using model healing.
A red ball indicates a session that was recorded in Image Validation mode and is a candidate for healing.
A green ball indicates a session that was recorded in Image Validation mode where the live and VSE responses match.
Identifies the unique ID for each session.
Displays the timestamp of the first transaction in that session.
Displays the timestamp of most recent transaction.
Identifies the number of transactions that were recorded after the service started.
(Protocol-specific) For HTTP, displays the endpoint of the client that submitted the transaction.
Identifies the most recent request that came through on the specific session.
Response Information Pane
The Response Information pane shows the list of transactions for the selected session. When you point the mouse to the colored ball in the first column of this pane, a tooltip identifies the match for that transaction. If you click any specific transaction, the request and response tabs appear at the bottom of the pane. These tabs compare request/response between the VSE system and the live system.
In the Response Information pane, the following icons represent transactions:
The Update buttons are used to update the service image with live session/stateless transactions. This process is referred to as model healing. You use model healing to remove the disparity between the VSE image and the live system so that the VSM works correctly. When you click Update, the session marked with a red ball changes to a gray ball. This session is now tracked.
|
Copyright © 2014 CA Technologies.
All rights reserved.
|
|