

The Metrics tab on the DevTest Console allows you to view VSE metrics.
Follow these steps:
To refresh the display, click Refresh. Use the Zoom slider and the Scroll slider to move the chart to make your data more visible.
Note: To view the metrics charts, the Adobe Flash plugin must be installed on the browser that is used to access the server console.
To define the parameters of VSE metric collecting, update the following properties in the lisa.properties file:
Note: For more information, see "Appendix A - LISA Property File" in Using.
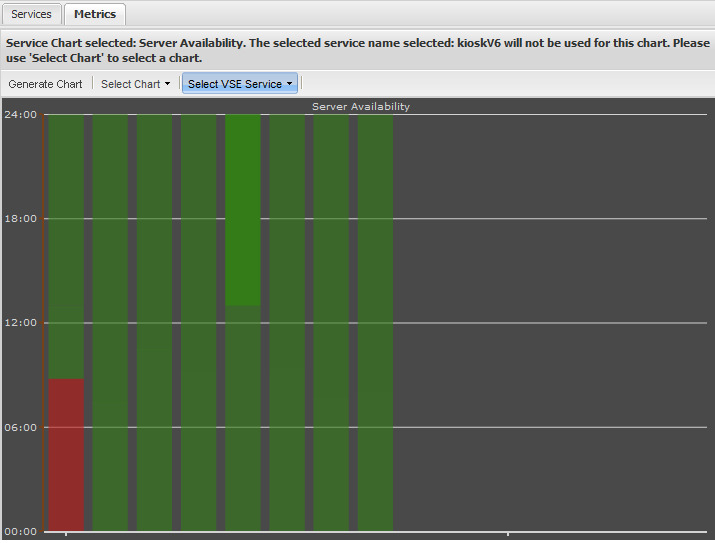
Server chart metrics apply to all activity on a specific virtual server, or VSE.
Note: If you select a server chart, the panel header indicates that the selected virtual service is not used for this chart. These charts apply to the entire server, not only the selected service.
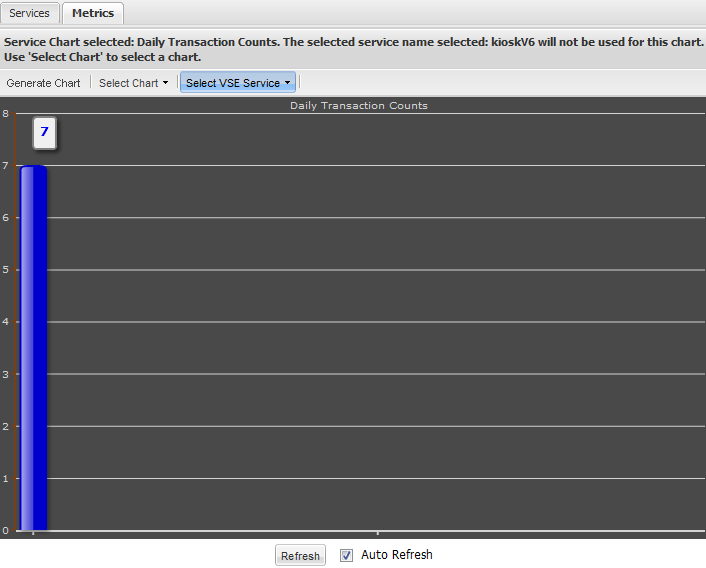
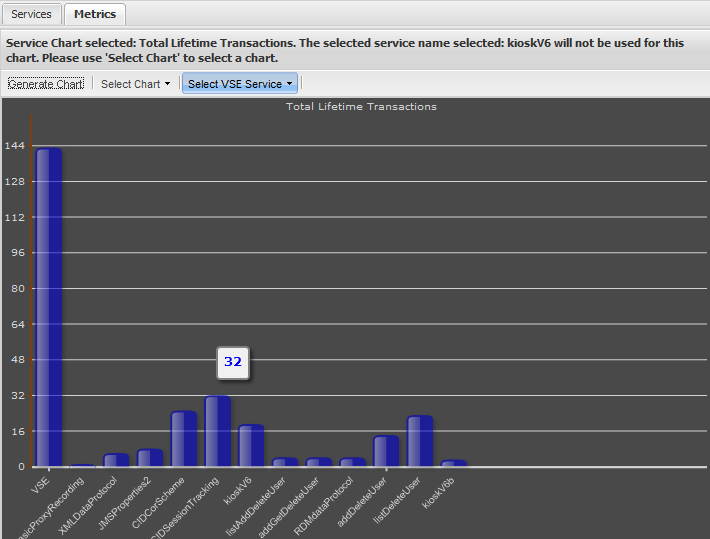
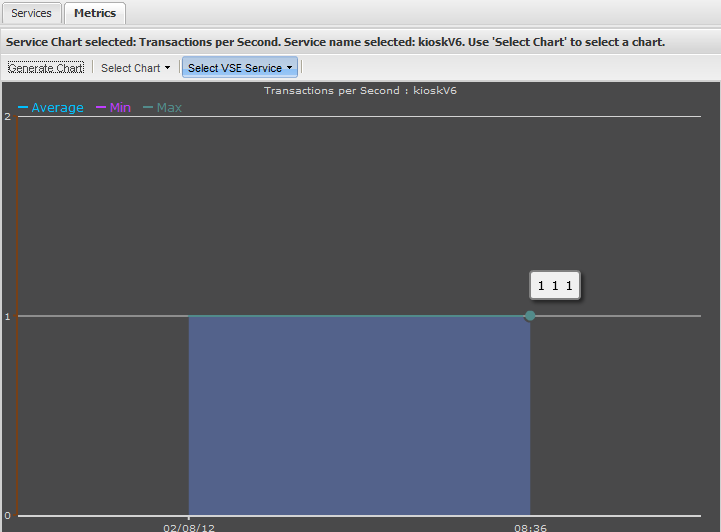
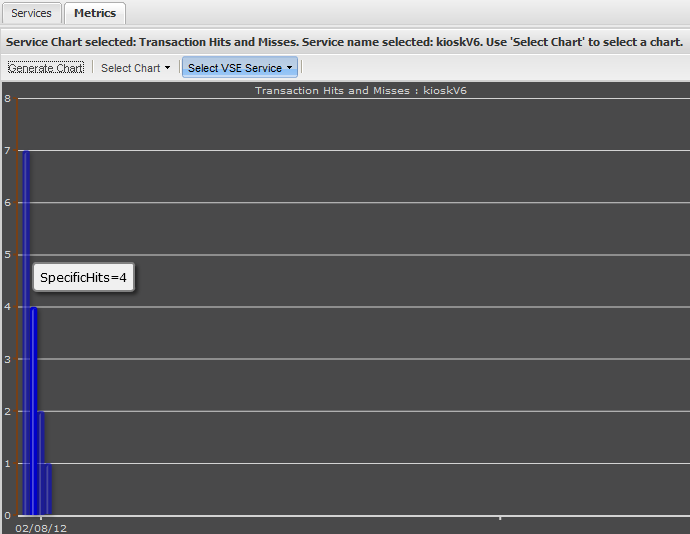
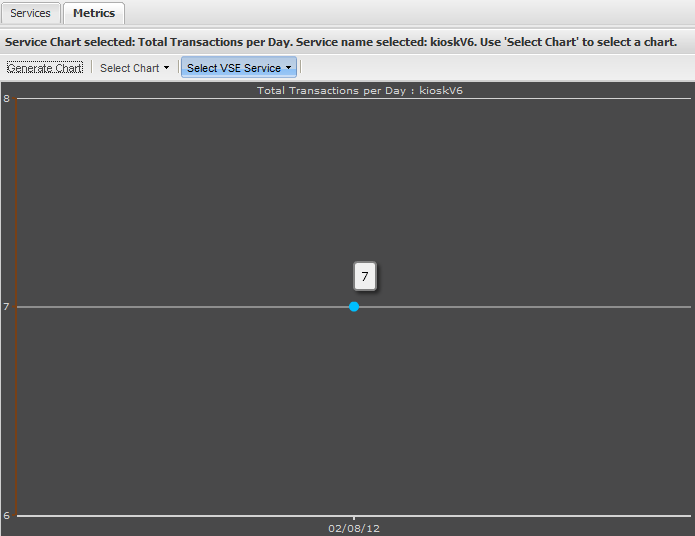
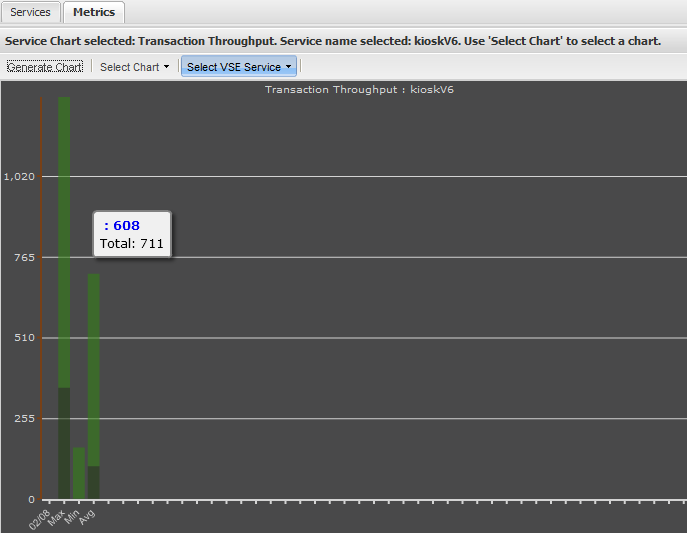
Service chart metrics apply to each virtual service. On the right pane, there is a list of virtual services that were deployed in this environment. You can select one of them, then select a chart from the list.
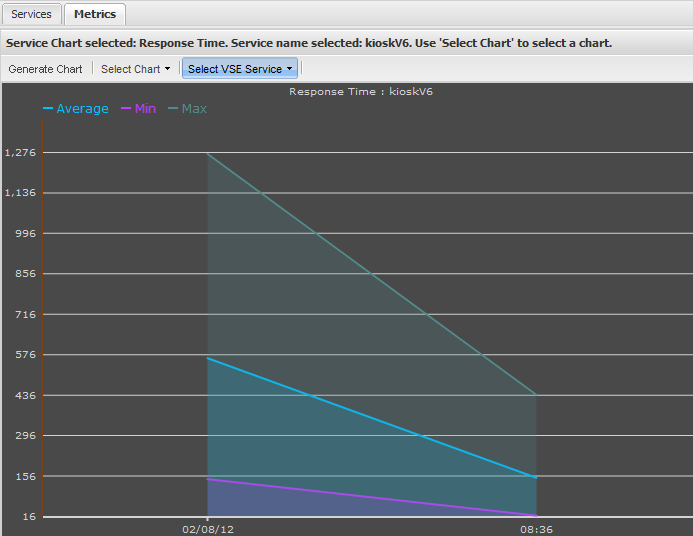
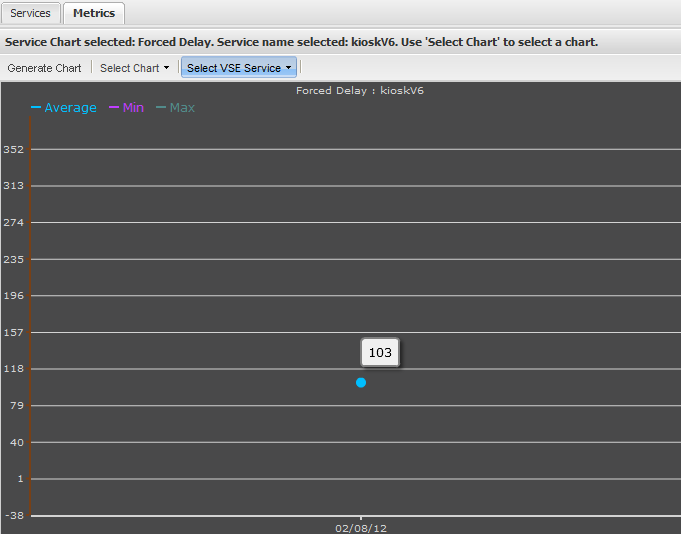
Indicates the number of milliseconds before VSE sent a result.
A positive number means VSE deliberately waited to send a result because of the specified think time. For example, if think time was 10ms and the time to listen and respond was 8ms, VSE waits 2ms.
A negative number means VSE took longer to generate the result than the think time. For example, the think time was 10ms but it took 12 ms to listen and respond was 12 ms. The report shows -2.
|
Copyright © 2014 CA Technologies.
All rights reserved.
|
|