

Administrator: Samantha
Samantha is a CA Clarity PPM administrator for Forward, Inc. She has received a request from William to build a dashboard that can help him analyze resource use. Samantha must use Xcelsius and CA Clarity PPM to implement an Xcelsius visualization using CA Clarity PPM Web Services.
Sample Files for this Example
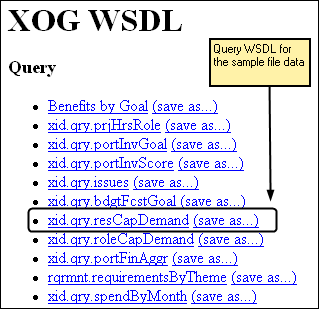
The solution shown in this example uses a portion of the sample design file Resource Dashboard.xlf that comes with the download: Design Files for Stock Xcelsius Visualizations. The supporting xid_qry_resCapDemand query is available from the WDSL Query to create or review the NSQL used in this example.
The following figure illustrates the model for her visualization:
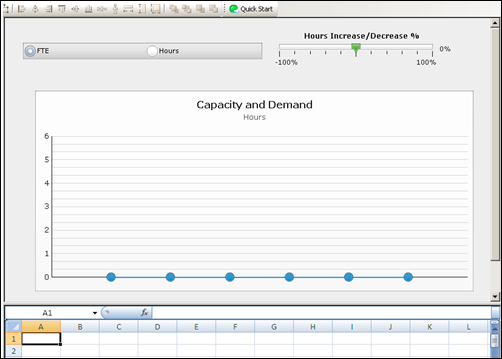
For information about how to map data in Xcelsius, refer to the SAP Xcelsius 2008 User Guide, or see the sample design file Resource Dashboard.xlf.
The following illustration shows an abbreviated version of the xid_qry_resCapDemand query to demonstrate the SELECT statements and the SECURITY clause.
SELECT	@SELECT:DIM:USER_DEF:IMPLIED:TEAM:cal.month_key:month_key@,
	@SELECT:DIM_PROP:USER_DEF:IMPLIED:TEAM:cal.period_start_date:start_date@,
	@SELECT:DIM_PROP:USER_DEF:IMPLIED:TEAM:cal.period_end_date:end_date@,
	@SELECT:DIM_PROP:USER_DEF:IMPLIED:TEAM:
		ROUND(SUM(amts.avail_hrs),0):capacity_hrs@,
	@SELECT:DIM_PROP:USER_DEF:IMPLIED:TEAM:
		ROUND(SUM(amts.alloc_hrs),0):demand_hrs@,
	@SELECT:DIM_PROP:USER_DEF:IMPLIED:TEAM:
		ROUND(SUM(amts.avail_hrs)/stdcal.avail,2):capacity_fte@,
	@SELECT:DIM_PROP:USER_DEF:IMPLIED:TEAM:
		ROUND(SUM(amts.alloc_hrs)/stdcal.avail,2):demand_fte@,
	@SELECT:DIM_PROP:USER_DEF:IMPLIED:TEAM:stdcal.avail:month_hrs@
FROM  SRM_RESOURCES r
INNER JOIN PRJ_RESOURCES prjr ON r.ID = prjr.prid
LEFT OUTER JOIN SRM_RESOURCES rl ON prjr.prprimaryroleid = rl.ID
INNER JOIN NBI_DIM_CALENDAR_TIME cal ON cal.hierarchy_level = 'MONTH'
INNER JOIN ( SELECT full_name, res_id, role_id, SUM(@NVL@(avail_hrs,0)) avail_hrs, SUM(@NVL@(alloc_hrs,0)) alloc_hrs, slice_date
        FROM (
         SELECT r.ID res_id, r.full_name, prjr.prprimaryroleid role_id, SUM(@NVL@(s.slice,0)) avail_hrs, 0 alloc_hrs, s.slice_date
            FROM   SRM_RESOURCES r
            INNER JOIN PRJ_RESOURCES prjr ON r.ID = prjr.prid  AND prjr.prisrole <> 1
            INNER JOIN PRJ_BLB_SLICES_M_AVL s ON r.ID = s.prj_object_id
            WHERE r.is_active = 1
            AND s.slice_date BETWEEN @DBUSER@.XID_DOM_FIRST_FCT(@SYSDATE@) AND @DBUSER@.XID_DOM_LAST_FCT(DATEADD(MM,5,@SYSDATE@))
            GROUP BY r.ID, r.full_name, prjr.prprimaryroleid, s.slice_date
        UNION ALL
            SELECT r.ID res_id, r.full_name, prjr.prprimaryroleid role_id,  0 avail_hrs, SUM(@NVL@(s.slice,0)) alloc_hrs, s.slice_date
            FROM  PRTEAM tm
            INNER JOIN SRM_RESOURCES r ON tm.prresourceid = r.ID
            INNER JOIN PRJ_RESOURCES prjr ON r.ID = prjr.prid
            INNER JOIN PRJ_BLB_SLICES_M_ALC s ON tm.prID = s.prj_object_id
            WHERE r.is_active = 1
            AND s.slice_date BETWEEN @DBUSER@.XID_DOM_FIRST_FCT(@SYSDATE@) AND @DBUSER@.XID_DOM_LAST_FCT(DATEADD(MM,5,@SYSDATE@))
		    GROUP BY r.ID, prjr.prprimaryroleid, r.ID, r.full_name,  tm.prid, s.slice_date
			) A
		GROUP BY full_name, res_id, role_id, slice_date
        )  amts ON r.ID = amts.res_id AND amts.slice_date BETWEEN cal.period_start_date AND cal.period_end_date
LEFT OUTER JOIN (SELECT r.ID res_id, SUM(s.slice) avail, s.slice_date
        FROM SRM_RESOURCES r
        LEFT OUTER JOIN PRJ_BLB_SLICES s ON r.ID = s.prj_object_id
        INNER JOIN PRJ_BLB_SLICEREQUESTS sr ON s.slice_request_id = sr.ID AND sr.request_name = 'MONTHLYRESOURCEAVAILCURVE'
        WHERE r.unique_name = 'xc_admin'
        GROUP BY r.ID, s.slice_date
        ) stdcal on stdcal.slice_date BETWEEN cal.period_start_date AND cal.period_end_date
WHERE @FILTER@
AND @WHERE:SECURITY:RESOURCE:r.id@
GROUP BY  cal.month_key, cal.period_start_date, cal.period_end_date,stdcal.avail
HAVING @HAVING_FILTER@
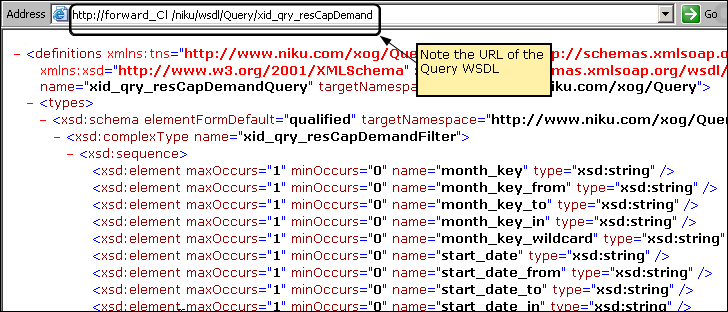
http://<servername:port>/niku/wsdl/Query
The following illustration shows an example of the result:
The following illustration shows an example of the result:
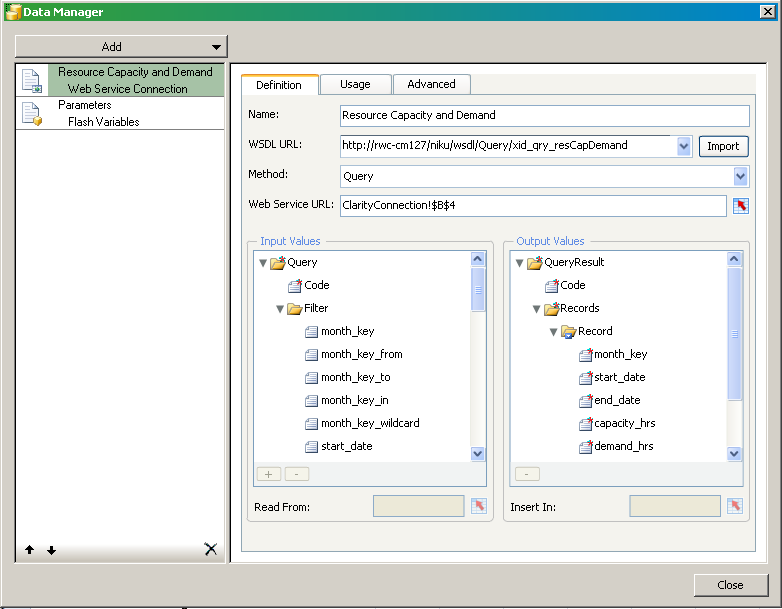
Samantha works with the Xcelsius Data Manager next to link the visualization to CA Clarity PPM data.
The following illustration shows the completed external data settings:
http://forward_Cl/niku/wsdl/Query/xid_qry_resCapDemand
where forward_cl is replaced with your actual WSDL URL
The method selected changes the attributes that appear in the Data Manager.
The next series of steps involve linking or binding data to cells in the embedded spreadsheet.
This cell range is added to the Web Service URL field. In a later step, Samantha creates a Flash variable (for example, pSessionID). She also creates a global parameter with the same name in the interactive portlet. At runtime, these combined settings allow the Web Service URL to pass a value from CA Clarity PPM using the Global parameter to the Flash variable. The Flash variable saves the value to the linked cell.
In a later step, she links the SOAP header to the session ID.
This action links the query to the visualization.
xid_qry_resCapDemand
The value of this cell is manually entered because once a query is created, it is absolute.
<n0:Auth><n0:SessionID>0000</n0:SessionID></n0:Auth>
where 0000 is her current Clarity Session ID.
Note: To get your current session ID, go to the About page in CA Clarity PPM, and copy and paste the session ID.
This information will enable you to test the real-time CA Clarity PPM data connection from Xcelsius.
This link is used at design-time to preview and test the connection from Xcelsius.
The one remaining cell to define is the Run-time session ID. This cell is addressed in a later step when creating Flash variables.
In the next set of steps, Samantha selects the data and selects a range of records. The range varies depending on the number of fields in the query and the number of records expected from the output.
Best Practice: In the worksheet, reserve the first column and first row for labels. To optimize performance, keep the output to 20 rows.
Samantha creates Flash variables next.
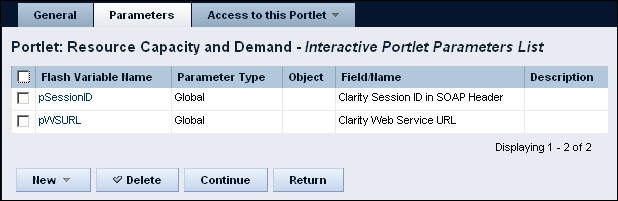
Samantha is ready to create the Flash variables that map to the global and object parameters in the interactive portlet.
This named Flash variable is mapped to the interactive portlet as the Clarity Session ID in SOAP Header global parameter.
This named Flash variable is mapped to the interactive portlet as the Clarity Web Service URL global parameter.
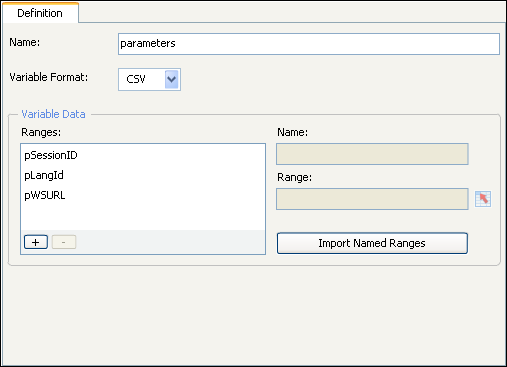
Note: The Flash variable (pLangID) shown in the preceding figure is present in the sample design file but is not covered in this example. The Flash variable has a corresponding global parameter in the sample design file which is also called pLangID. This corresponding global parameter is designed to manage languages. For information about handling this parameter, see the Xcelsius product documentation. You can see one implementation of the parameter by viewing the downloaded sample file in Xcelsius.
Samantha is now ready to test the connection between CA Clarity PPM and Xcelsius by viewing the data.
Samantha now views the visualization in Xcelsius to make certain the connection is good and data is moving from CA Clarity PPM to Xcelsius. When the test is done, Samantha can create the interactive portlet that displays the visualization in CA Clarity PPM
She sees that information is populating the bar graph and determines that the visualization is working exactly as designed.
|
Copyright © 2015 CA Technologies.
All rights reserved.
|
|