

Introduction › How to Quickly Assess System Health
How to Quickly Assess System Health
This scenario explains how a database administrator uses CA Chorus to identify system health quickly.
Each morning your DBA can start the day by quickly surveying the system to identify known issues and the general health of the subsystem. The following diagram and text show the steps to identify system health:
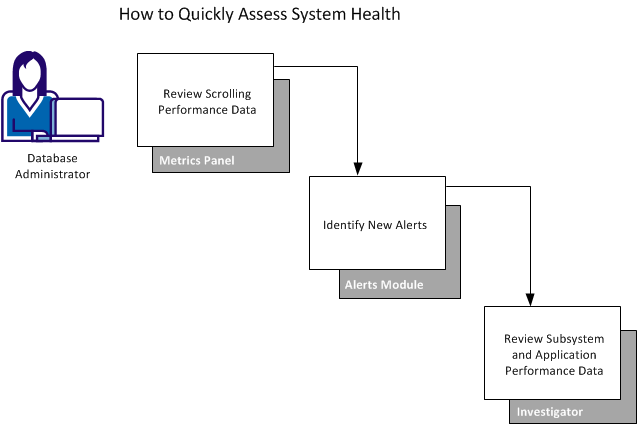
The DBA logs into CA Chorus and completes the following steps:
- Review the scrolling data from the Metrics panel.
- For critical issues, the DBA stops the scrolling feature and clicks the down arrow to increase the display size and display details about the metric.
- If necessary, the DBA can launch the Investigator to gain a clearer understanding of the situation.
- Open the Alerts module to identify issues.
For critical issues, the DBA launches the Investigator to begin root cause analysis. The Investigator opens at the appropriate location that is based on the information available from the Alerts module. For example, if the alert is based on a threshold in a buffer pool, the bufferpool object data is displayed.
- Add the Investigation Launcher module to a dashboard, click Start New Investigation, and drill down to the applicable subsystem
- Select Overview Snapshot from the Subsystem Performance folder. This folder provides a real-time system status overview of the DB2 subsystem to help you determine at a glance the health of the subsystem.
- Select a performance entity from the Application Performance folder. From here, highlight a critical application (plan, package, and so on) and select the details option under the Actions pane. The DBA can review these details to identify any questionable activity.
By beginning the day in this manner, the DBA quickly identifies the health of the system. Most likely, the result of this inquiry leads the DBA to the first task of the day (troubleshooting, performance tuning, and so on).
Copyright © 2015 CA Technologies.
All rights reserved.
|
|