

This topic shows how a storage administrator can analyze DASD to determine if current costs are within target limits. DASD that sits above target limits can mean increased costs for your site.
Follow these steps:
The Investigator opens.
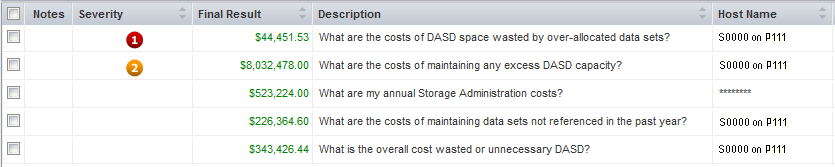
Each row poses a question about your storage environment. We recommend that you review those with a severity code. In the following example, the first row shows a severity one, and the second row shows a severity two. The severity column is blank in the other rows because the scenario results are within accepted (target) limits. The following illustration is an example of the Current Analyses object table for a single host:
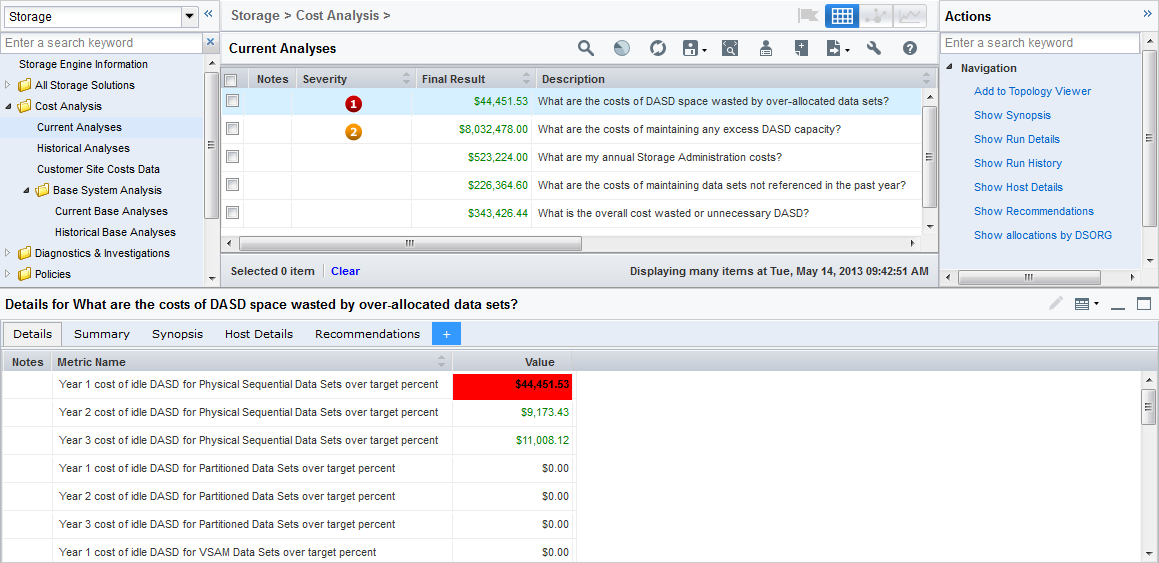
The Actions pane on the right-side of the table and the Details pane at the bottom of the Investigator window expand, as shown in the following example.
Note: The Details tab in the Details pane is selected (by default).
The Alloc/Idle Bytes Dsorg (DTOCDSOR) summary object opens. This object contains the storage resource data used in the analytical calculations. This object summarizes data sets according to their DSORG (data set organization group) field. The number of data sets for each data set organization is shown, with other summary statistics about the allocated space, idle space, and number of extents for each data set organization group.
This step changes the column sequence in the object display so that you can see the number of data sets right after the total amount of idle bytes.
The Show allocations by DSORG table is updated and the Tot Idle Bytes column is now displayed after the Nbr Of DSNs column in the table.
The table now shows the data set organization types with the highest number of total idle bytes at the top of the list.
This customization helps you identify which data set organization groups have over-allocated data sets (the groups with highest amount of idle space), which you can reduce.
The Actions pane expands and the Details pane at the bottom of the Investigator window is populated with the Details tab selected.
The information displayed in the Details tab is the same information that is displayed when you select the Navigation Action Show Run Details. Both options show the total cost by year, for the different data set organization groups.
Note: The erosion factor used is the percent value of the DASD_ANNUAL_COST_EROSION_PERCENTAGE variable. You can see this value in the Customer Site Costs Data object.
The cells containing values that are above your accepted target value have colored backgrounds.
The following illustration shows the Details pane with the Details tab selected.
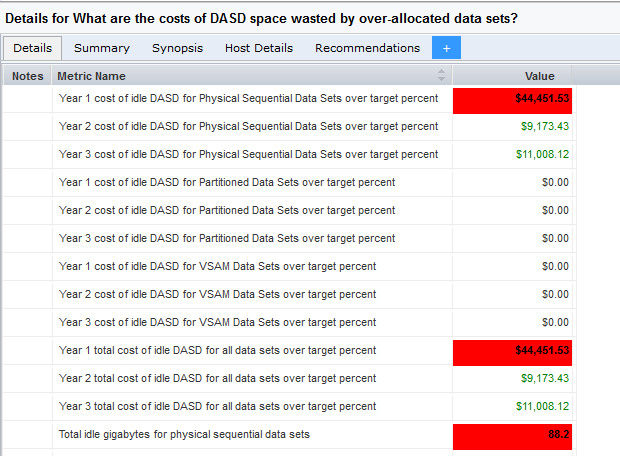
Displays the details of the Costs of DASD space wasted by over-allocated data sets scenario details in a form format.
Shows how the value of the scenario is calculated.
Note: The contents of the Actions pane and the Details pane pertain to the scenario selected by clicking anywhere in the row besides the check-box of the scenario row. Selecting the check box on a row does not expand the Details pane.
The Actions pane expands and the Details pane at the bottom of the Investigator window is populated with the Details tab being selected (by default).
Details of the values used to perform the cost analysis. It also provides costs for the current year and the next two years (projected costs).
Provides an analysis of the cost of excess DASD capacity over and above what is required for peak demand.
Provides an explanation of the analysis.
Provides a recommendation of how to reduce costs.
In this example, the information in the analysis indicates you are above your target limits and you need to reduce your DASD related costs. You now have an overview of the actual costs of your excess DASD capacity. You also have an overview of the costs of maintaining the excess DASD capacity and a recommendation of how to reduce it.
|
Copyright © 2013 CA Technologies.
All rights reserved.
|
|