

This procedure helps you configure the Policy Status Light module. This module lets you monitor user-customized policies in a color-coded window. This view lets you see at glance if the system has exceeded the thresholds in your policies. This module helps you respond quickly to performance changes.
Note: Ignore steps 1 through 4 of the following procedure, if you have already configured the module.
Follow these steps:
The Object Picker opens.
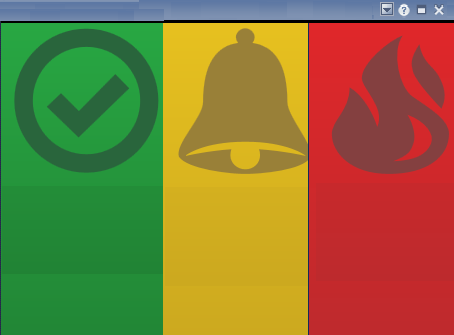
The Policy Status Light displays the policies in your Dashboard. The following colors and icons indicate the health state of your policies:
Hover over a Policy Status Light to see the list of objects that are in the same condition. If there is only one policy and if it gets deleted, the Policy Status Light notifies you with the green color that the policy is no longer available.
Consider that your policy contains other objects such as processor usage. When the processor usage and the memory usage are in the worst condition, the hover text displays both memory usage and processor usage.
You can select individual or all policies from the middle pane of the Object Picker window, provided the number of objects is limited to a few hundred. A higher number of objects consumes more resources, and makes the system slow.
Best practice on Select All Usage:
Use Select All when building a policy rather than selecting individual objects. That way, if similar, new objects are created, they will be covered by the policy without any additional configuration. Note the following points to avoid high CPU usage:
Example:
You have four policies named P1, P2, P3, and P4. The following list details your policies:
The following table shows how you can configure the Policy Status Light to display your objects:
|
Option |
View |
|---|---|
|
Show Overall (default view) |
One red light and hover text for one P1 object and three P3 objects. |
|
Group By Policy |
Four lights:
|
|
Group By Object Type |
Three lights:
|
|
Show Object Instances |
9 lights, which is the sum of the policy objects. |
You have created a memory usage dashboard for your site Boston Product Lab, created and selected policies, configured the Policy Status Light module, and started monitoring the memory usage of your server.
In the future, if a threshold is crossed, you can right-click the policy on your dashboard, and select the Investigate option to identify root cause. You can then use several tools in the Investigator to identify the root cause. For example, add the object of the policy that showed 95 percent of memory usage to the Time Series Facility, duplicate the chart, and compare it with the same time on the previous day using the time slider.
|
Copyright © 2015 CA Technologies.
All rights reserved.
|
|