

After you configure the module for your discipline, the Alerts dialog displays the alerts that are already generated. The following screen capture details the Alerts window:
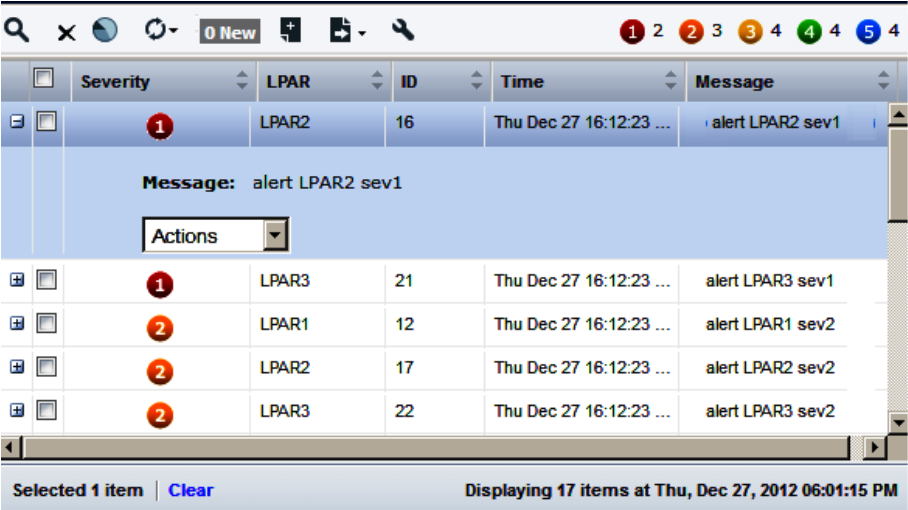
The auto-refresh option is enabled by default for authorized users. When this option is enabled, any changes in back-end data refresh the front-end data once every 30 seconds. For example, when the server generates new alerts, they appear in the Alerts module after 30 seconds. Click Refresh (![]() ) to disable or enable the auto-refresh option. If you are not an authorized user, click Refresh (
) to disable or enable the auto-refresh option. If you are not an authorized user, click Refresh (![]() ) to refresh the data manually.
) to refresh the data manually.
You can view the alert counters based on severity. The alert counters are refreshed when you click the refresh button or the new alerts button or when you delete an alert.
You can customize the tabular view of the dialog data by clicking the wrench icon. You can view details about an alert to investigate an issue on a monitored system.
After you view the alert details, you can analyze the resource or application from which it is occurring to determine the root cause. During the investigation, you can add notes for future reference and can see notes from coworkers related to the resource activity.
To see the available options to manage alerts, hover over the toolbar.
Follow these steps:
Displays more information (for example, when and where the alert occurred) about the alert.
Launches the Investigator. The Investigator opens to the system where the alert occurred, and displays information about the relevant performance area.
Note: The Notification icon in the Investigator toolbar notifies you when messages are available from the back-end products.
Clicking the View Filter or View Charts icons maximizes the Alerts dialog. Restoring the dialog hides the filtering or charting panels.
|
Copyright © 2015 CA Technologies.
All rights reserved.
|
|