

The Dashboard uses roll-up methods to calculate severities of higher level entities in the hierarchy. These roll-up methods are customizable to allow reflecting of important concerns and better control the influence of each of the components in the overall picture. The available roll-up methods are:
In this method, if more than X percent (default is 33.5 percent) of the children entities are red, the parent entity is red. If more than Y percent (default is 33.5 percent) of the children entities are yellow, the parent entity is yellow. Otherwise, the parent entity is green. If the roll-up calculation ends up with more than one result the worse severity is taken (e.g., prefer red over yellow).The X and Y parameters are configurable under Administration, Site Settings, Advanced, Dashboard, Custom count rollup.
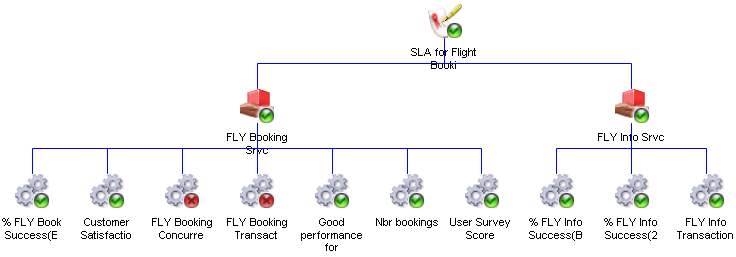
For example (see figure), a contract composed of two services (S1 and S2). S1 is composed of seven metrics and S2 is composed of three metrics. For S1, the number of red metrics (two in the figure ) is divided by the total number of metrics for S1 (seven in the figure). The value (28.6 in the figure ) is compared to the value set under Administration, Site Settings, Advanced, Dashboard, Custom count rollup (33.5 in the figure ). Since the value is lower, S1's severity is green. For S2, there are no red or yellow severities, so S2's severity is green. This process is repeated for the contract to determine its severity.
In this method, each severity is assigned a representative score: Red=X, Yellow=Y and Green=Z (default values are X=0, Y=50, Z=100). The parent score is the average of its children scores. The parent color is determined by matching its score with the thresholds.
The X, Y and Z parameters are configurable under Administration,Site Settings, Advanced, Dashboard, Average Score Rollup
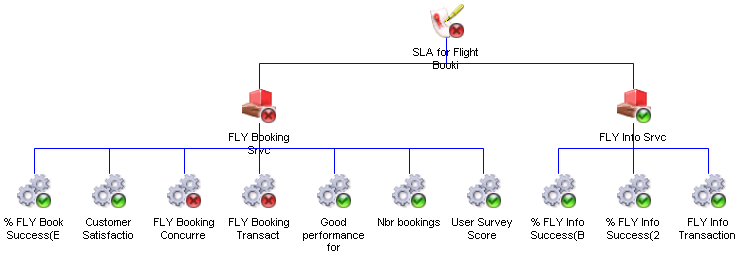
For example (see figure below), a contract composed of two services (S1 and S2). S1 is composed of seven metrics and S2 is composed of three metrics. For S1, each metric's severity is assigned a score, the scores are added and then divided by seven to get the average value (71.4 in the below figure). This value is compared to the thresholds (33 for red and 66 for yellow) and the severity is determined (green in the below figure). For S2, each metric's severity is assigned a score, the scores are added and then divided by three to get the average value (100 in the below figure). This value is compared to the thresholds (33 for red and 66 for yellow) and the severity is determined (green in the below figure). This process is repeated for the contract to determine its severity.
In this method, if one or more children entities are red, the parent entity is red. If one or more children entities are yellow, the parent entity is yellow. Otherwise, the parent entity is green.
For example (see figure below), a contract composed of two services (S1 and S2). S1 is composed of seven metrics and S2 is composed of three metrics. If at least one of the metric's severities for either service is red, the service is red and in turn the contract.
The roll-up methods also take into consideration situations where one of the severities is gray. The possible reasons for a gray entity are:
In all these situations, except for a metric whose result is not yet calculated, all the roll-up methods calculate the severity as if the entity is not there (i.e. ignore it).
When a complex entity monitors current status results and some metrics are not enabled for current status, these metrics are not displayed in the Analysis window and are ignored during the roll-up calculation.
When a metric's result is not calculated, the roll-up methods calculate the severity of the higher level entity as follows:
By configuring the roll-up methods, the user can control:
When a metric is defined to be a clustered metric, the Dashboard takes into account results of intermediate levels in the clustering tree. The Dashboard then calculates the severities of each node in the tree by taking the service level or deviation results for each node and compares it to the metric thresholds.
A clustered metric is considered in the Dashboard to be a complex entity containing resources and/or resource groups. The clustered metric is calculated and displayed on the Dashboard according to each clustering mode defined for the metric as follows:
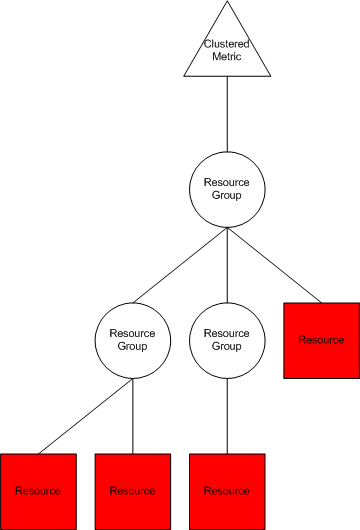
When a metric is clustered using this option, calculation results are available only for the nodes as indicated in the below diagram.
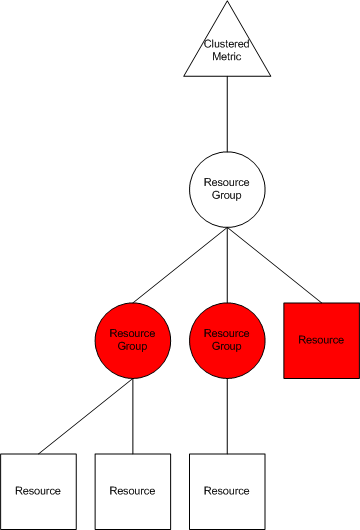
When the user opens the Analysis page for this metric, the following structure displays where the metric's severity is calculated based on the aggregation of the highlighted items and according to the roll-up method selected for the metric.
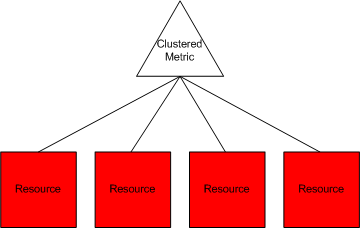
This clustering option is a private case of the First Level option and the same rules apply here. The user can select individual items from the first level and only those items are calculated and displayed in the Analysis page.
When a metric is clustered using this option, calculation results are available only for the nodes as indicated in the below diagram. The severity calculation for the metric is based on the aggregation of the severities of the leaf nodes.
When the user opens the Analysis page for this metric, the following structure displays where the metric's severity is calculated based on an aggregation of the highlighted items and according to the roll-up method selected for the metric.
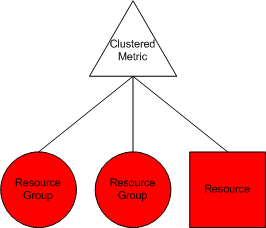
When a metric is clustered using this option, calculation results are available for all nodes in the clustering tree as indicated in the below diagram. Therefore, every node in the tree has a severity based on the service level or deviation results compared to the metric's thresholds. There is no roll-up of severities and the severity of each item in the tree is calculated independently.
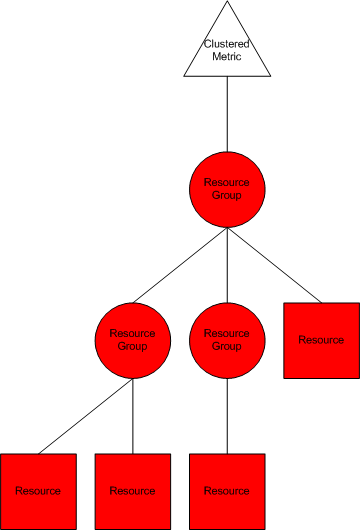
When the user opens the Analysis page for this metric, all the items in the hierarchy are displayed (same as diagram). A clear indication of how the severity of each item was calculated is found in the Properties panel under Severity Description.
|
Copyright © 2012 CA.
All rights reserved.
|
|