

To view the networks, servers, and applications that are related to a performance degradation, click one of the worst-performing components at the top of a view.
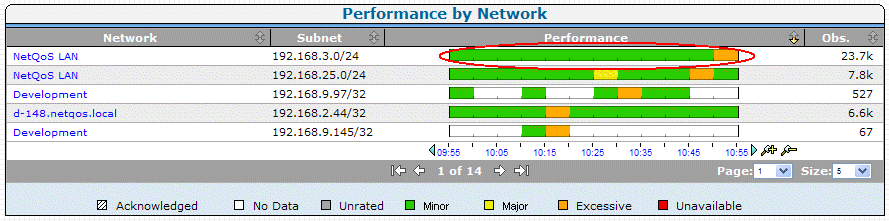
For example, if you click the performance bar for the NetQoS LAN network, the management console displays the network metrics along with the affected servers and applications. To view servers and applications that are not affected by the Minor network performance degradation, click to expand the Unrelated link. The Unrelated folder includes components that are rated as Normal, are Unrated, or do not have any data.
Note that the management console displays an icon in front of a component to indicate its type. The following icons do not indicate the status of a component:
|
Icon |
Description |
|---|---|
|
|
Network |
|
|
Server |
|
|
Application |
|
Copyright © 2015 CA Technologies.
All rights reserved.
|
|


