

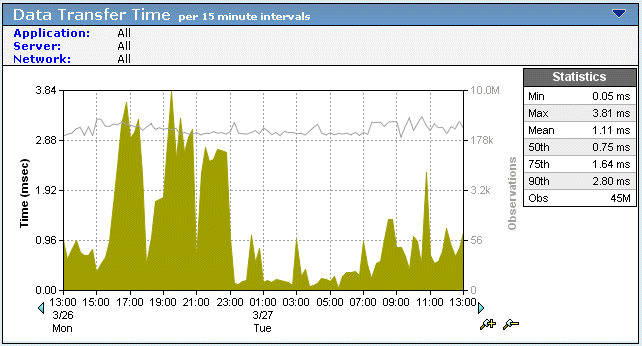
An increase in the Data Transfer Time and in Observations count is a good indicator that a performance problem is associated with the application.
The strength of this indicator can be significantly increased by correlating it with corresponding data points to build a complete finding that the problem source is the application.
Performance problems associated with an application vary by site depending on available bandwidth and latency caused by distance. It is not uncommon for a subset of application users located at the same site to complain about application performance. You can query across applications to see if the spike in Data Transfer Time can be correlated to applications crossing the same network path, or originating from the same server. If so, the problem might be in the network or server.
If an increase in Data Transfer Time is isolated to a single application on a single server, and both the Data Transfer Time and number of Observations spike at the same point in time as the observed performance issue, review the following data sets for that time:
Check whether the Data Volumes/Rates increased. The application might not be writing effectively across slow WAN links or to sites that are far way in terms of distance.
Check whether the NRTT and Retransmission Delay remained somewhat constant as the volume increased. Somewhat constant and acceptable Network Round Trip Time coupled with insignificant packet drop indicates an application issue.
Check whether Server Response Time increased. Increases in Server Response Time without increases in session or user counts, unfulfilled TCP session requests, and NRTT indicate the problem is the application.
Check whether there is a concurrent increase in Server Connection Setup Time. Such an increase indicates the OS kernel increased the amount of time that it took to respond to new session requests.
Check whether the number of TCP/IP sessions increased by a significant number (greater than 10%). Additional TCP sessions and accompanying application requests require more resources from the server and tax its horsepower.
Check whether Unfulfilled TCP/IP requests remained constant (optimally zero). An absence of unfulfilled TCP requests during active session establishment demonstrates server resources were available to users, and further relieves the server of responsibility for the performance issue.
Check whether there are a constant number of users before, during, and after the performance event. The absence of new users to the server at the time of the performance event tends to absolve server load as a factor.
Check whether there was an increase in the standard deviation for Data Transfer Time and/or Percentiles -- without an accompanying increase in NRTT or a significant increase in Server Response Time. Such an increase indicates inconsistent and sporadic performance by the application as evidenced in more "outlying" data points (such as, points that are at significantly varying distances from the average), and is a good indicator of application based issues.
|
Copyright © 2015 CA Technologies.
All rights reserved.
|
|