

First determine if another application is active on the server.
If another application appears in the resulting Performance Map, repeat these steps to determine if it is the problem source for the performance issue.
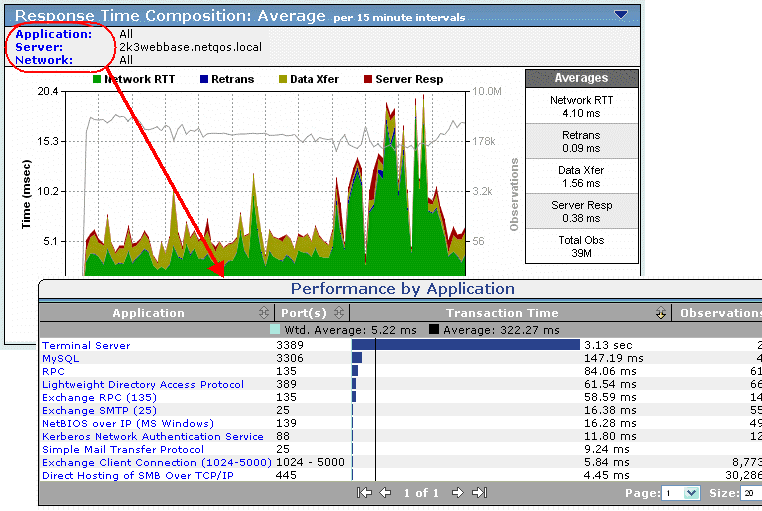
The key is an increase in the number of observations for the particular application at the same time the performance problem was reported.
Examples of applications that create issues for the primary application on a server are:
Backup processes are typically scheduled through the backup software agent for recurring time periods. Therefore, there should be a pattern visible on the Trends views showing cyclical spikes of Server Response Time at the same time every 24-hour period, every other 24-hour period, or whatever the backup schedule dictates.
Upgrades to anti-virus definitions are typically done on a weekly basis, or in emergency situations on an "as needed" basis. Consult with your anti-virus software vendor and/or desktop/security team to determine the automated update release schedule. Occasionally, application development teams might install third party agents or encode performance agents into their software. Review change notifications to determine if any changes to the software on the server have been made just prior the start of the performance issue.
Determine if the server/application service has become unreliable.
|
Server |
Switch |
Result |
|---|---|---|
|
Auto |
Auto |
Full duplex, auto speed |
|
Auto |
Manual |
Half duplex, manual speed |
|
Manual |
Auto |
Half duplex, manual speed |
|
Manual - Full |
Manual - Full |
Full duplex, manual speed (Assumes same speed, 10 Mbps, 100 Mbps, 1000 Mbps, is set on both ends) |
|
Copyright © 2015 CA Technologies.
All rights reserved.
|
|