

The Operations page displays horizontal bar charts that compare overall performance elements to a threshold. The worst-performing monitored networks, servers, and applications are listed in descending order on each view.
You can quickly see the areas of concern in the enterprise.
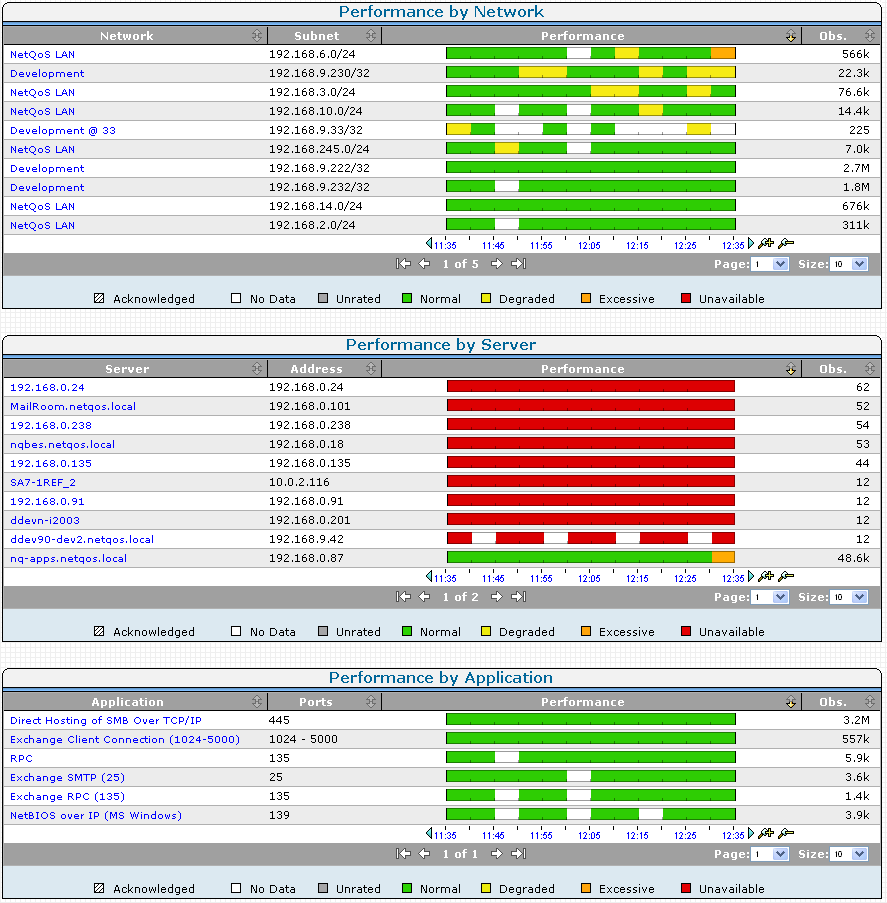
To isolate the component and metric contributing to the performance problem, click one of the worst-performing items at the top of its view.
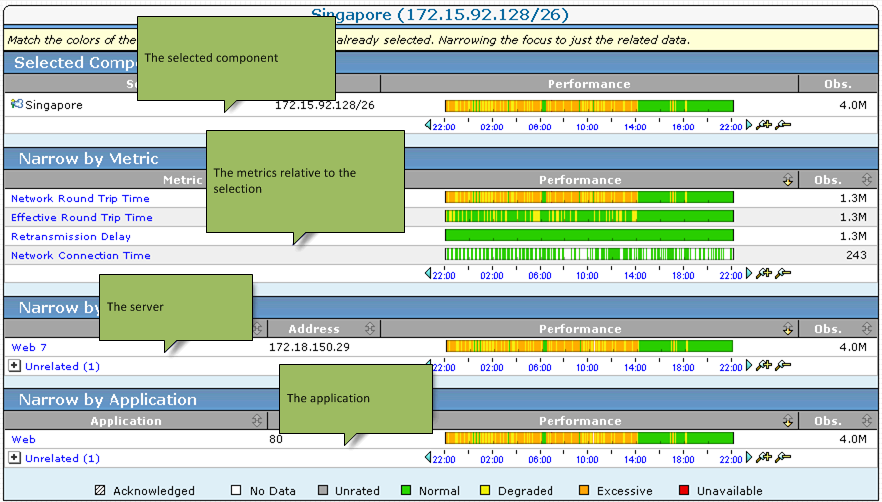
In the following example, the Singapore network provides information about:
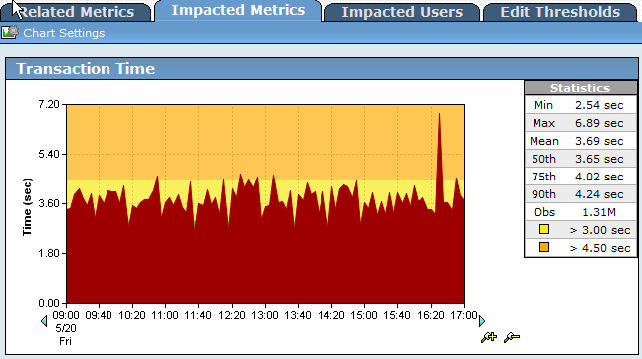
To investigate the performance further, select the matching performance profiles and then click Explore to see more details:
|
Copyright © 2015 CA Technologies.
All rights reserved.
|
|