

The Server Response Time view shows the time a server takes to respond to an application request. This view displays information for applications in the server segment. Where SPAN data exists, the management console uses it to populate this segment; otherwise, the management console uses FlowAgent data from the server side of the data center WAN-optimization device.
The following example view, which accompanies the Response Time: Average view, shows the same 50-fold increase in transactions for this HTTP application with no appreciable change in Server Response Time.
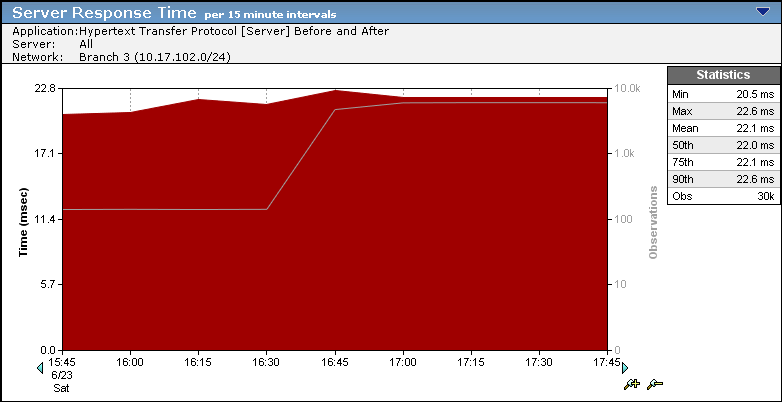
The Response Time: Average view shows a significant improvement in data center efficiency. The Server Response Time view quantifies the benefit of data center offload whenever client-side caching is active. The Server Response Time value can be affected by server speed, application design, and volume of requests.
|
Copyright © 2015 CA Technologies.
All rights reserved.
|
|