

The Response Time Composition: Average view shows Transaction Time for the Client application segment. This view reflects the true client experience. The measurements come from:
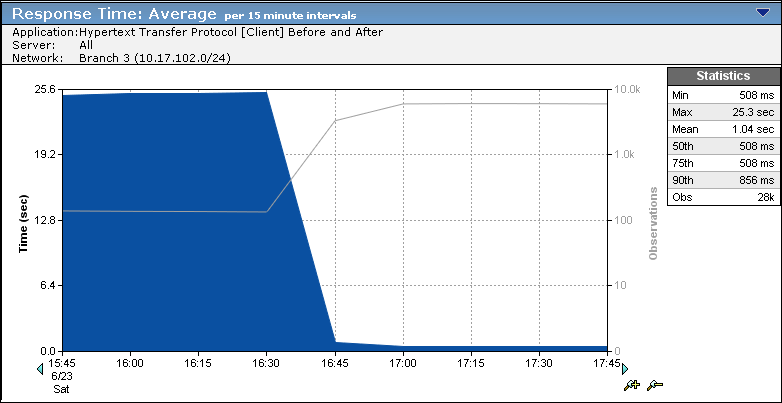
This example view shows the before-and-after impact of WAN-optimization on an HTTP application. Users from this subnet experience a 25-fold decrease in response time and a 50-fold increase in transactions.
A transaction is a single request and a single server response, one period of data transfer, one or more acknowledgments, and observed latency caused by retransmitted packets.
|
Copyright © 2015 CA Technologies.
All rights reserved.
|
|