

Using the Operations Page › Troubleshoot an Application Performance Problem
Troubleshoot an Application Performance Problem
Use this procedure to troubleshoot a performance problem with an application. You can use the same procedure to investigate a problem with a network or server by clicking a link to narrow by metric, network, or server.
A user from corporate headquarters reports a performance problem with an application.
Follow these steps:
- Click the Operations page.
- Click Applications in the Show Me menu.
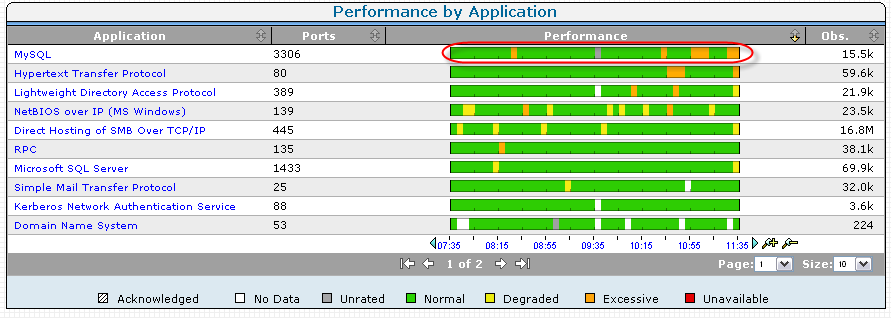
- Determine if the application in question has bubbled to the top of the Performance by Application list.
If the application does not appear at the top of the list, select a larger Size setting. If the application does not appear on the list, the management console might not monitor it.
- Click the performance bar next to the application name to show details about the application.
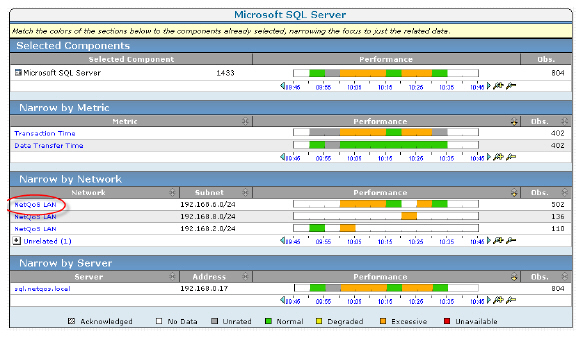
A detail page shows related metrics, networks, and servers you can use to navigate into data related to the problem.
- (Optional) If you know the network or server that hosts the application, click the appropriate performance bar to narrow the scope of data.
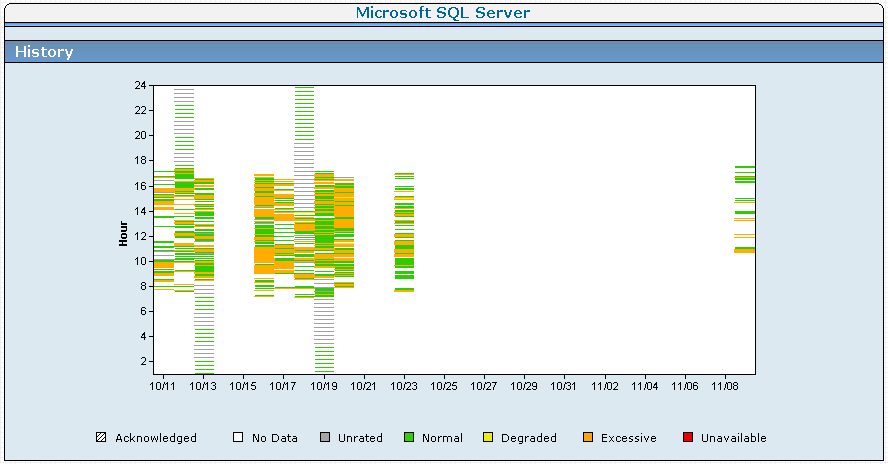
- Click History in the Show Me menu.
- Review the application history on the History page to identify and note systematic patterns of unavailability or compromised performance.
- Click Performance in the Show Me menu, and then Explore to begin troubleshooting.
- Perform more exhaustive troubleshooting by clicking the Engineering link at the top of the detail page.
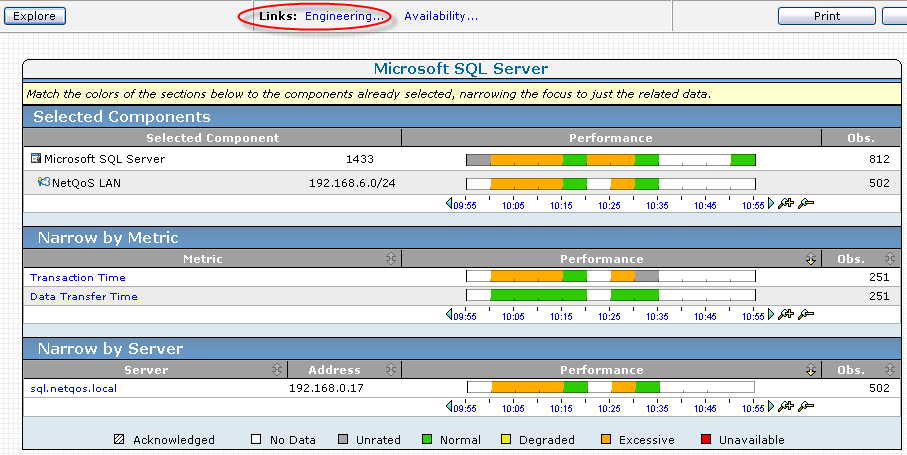
- Review the Response Time Composition: Average view on the Components Report page to pinpoint the time the reported issue occurred.
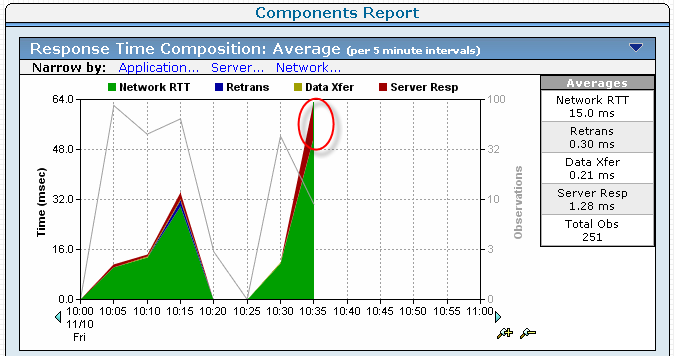
- Identify which metric is the significant contributor to the performance problem at that point. If the metric that sees an increase in response time is:
If the metrics report acceptable performance with respect to the historical timeline, the problem might be with the user’s computer.
Copyright © 2015 CA Technologies.
All rights reserved.
|
|