

By default, the management console averages data over preset intervals to produce data points. For each time interval used to average data, the management console calculates a representative data point and shows this data in a chart or table. Each chart and table reports the time period used to calculate each data point.
For views that use the time periods in the following table, the management console averages data using the following intervals:
|
Time Period |
Interval |
|---|---|
|
Last hour |
5 minutes |
|
Last 8 hours |
5 minutes |
|
Last day |
15 minutes |
|
Last week |
1 hour |
|
Last month |
6 hours |
Configure reporting of data points as follows:
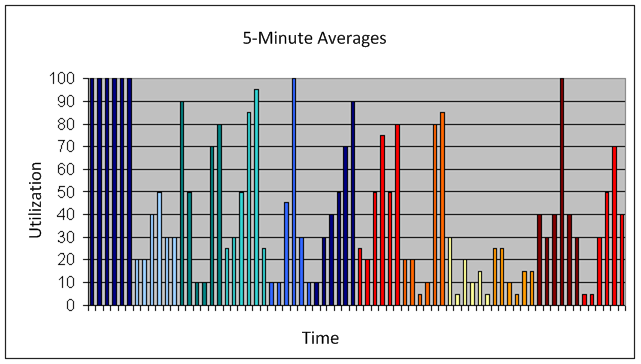
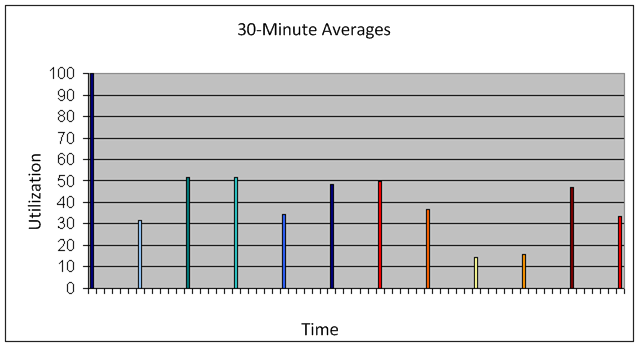
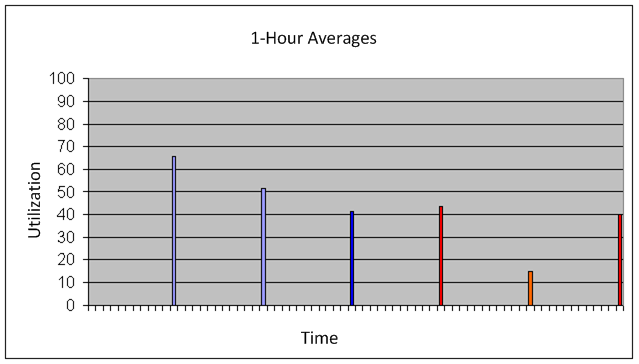
The following views show the transition of granular data points to curves used for trending and pattern identification as the averaging interval increases from 5 minutes to 1 hour.
|
Copyright © 2015 CA Technologies.
All rights reserved.
|
|