

Analysis › Multi-tiered Application Performance › Analyze Multi-Tiered Application Performance
Analyze Multi-Tiered Application Performance
Use the management console to analyze multi-tiered applications the same way that you analyze single-tiered applications with two exceptions:
- A lower-tiered application’s performance often depends on an upper-tiered application’s performance.
- When reporting on each tier, set up the tier above as you would set up a network and set up the tier below as the server and application.
In the example in the previous section, the Tier 2 HTTP Web application’s performance is a function of the Tier 3 Oracle database server performance. It follows that the Tier-N HTTP Web server appears as the client in reports while the Tier N+1 host appears as the server/application.
When you analyze N-tier applications, begin with the highest tier (the one farthest away from the end user) and work your way toward the user. Note the effects of dependent performance points on the dependent tiers. The common dependent performance points between tiers follow in the probable order of occurrence.
- Server Response Time (SRT) of Tier N+1 impacts SRT of Tier N.
- SRT is a function of server resource utilization. High values indicate the server might not have enough memory, CPU, or disk I/O resources to service the application for a given load.
- Review the Sessions and QoS views to determine what session or user is placing too much load on the server during instances of slow SRT.
- Network Round Trip Time (NRTT) between Tier N and Tier N+1 is high and affects data throughput.
- NRTT within a LAN environment is a function of the switch backplane speed and contention for bandwidth on shared uplinks between switches. Best practice is to always put the primary NICs of N-Tier applications on the same switch and within the same VLAN to remove contention for uplink bandwidth issues and to remove two extra switch hops between servers. This can dramatically increase N-Tier application performance.
- Review the Traffic and Data Volume views to determine if NRTT increases with an increase in volume. If so, there might not be sufficient bandwidth between the two servers for the application.
- Data Transfer Time (DTT) between Tier N and Tier N+1 is exactly zero or converges to zero. Review the Response Size and Data Transfer Time by Response Size views to see if the application uses diverse response sizes greater than 1.45 KB, which is the amount of data that fits into one packet. A DTT of zero or near zero typically indicates that a single packet is being sent by the back office server for each user request. For database servers, this is typically in the form of a query requesting one row of a data many times instead of asking for all the rows in a single query. Rewrite the queries for optimal performance.
- Retransmission Time between Tier N and Tier N+1 indicates significant packet loss.
- Review the Traffic and Data Volume views to determine if large volumes of data are being transferred during times of high retransmission times.
- Review the Sessions and Network Connection Time views to determine what the latency is for TCP session startup. High values indicate congestion between the two tiers.
The following charts illustrate a Server Response Time dependency between Tier 2 and Tier 3 of an application architecture. The SRT of the Tier 2 server follows the SRT of the Tier 3 server during periods of high response times.
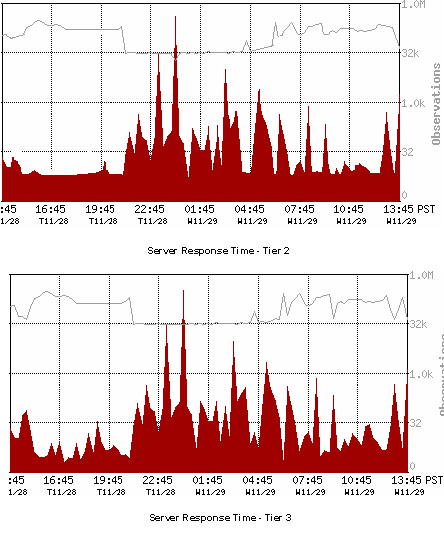
Trailing data points between the two tiers indicate that the Tier 3 server performance affects the Tier 2 server performance. The Tier 3 server is a bottleneck in this application architecture.
When the Tier N application latency has the same general curve as the Tier N+1 application latency during peak latency spikes, the Tier N application is probably being adversely affected by the Tier N+1 application.
After you identify the performance bottleneck in the Tier N+1 application (high SRT indicating server issues, high NRTT and retransmission times indicating network issues, zero or high data transfer times generally indicating application issues when SRT and NRTT are low) and correct it, repeat the analytical process to identify secondary bottlenecks.
Copyright © 2014 CA Technologies.
All rights reserved.
|
|