

CA Virtual Assurance is a policy-based product that automatically monitors physical and virtual resources to meet the load demands of complex data centers dynamically. CA Virtual Assurance uses a Service Oriented Architecture (SOA) and continuously analyzes your data center to verify that your servers are optimally provisioned to perform required tasks. You can manage your data center and obtain detailed information about each managed computer in your data center using the web-based user interface.
CA Virtual Assurance integrates with the following external technologies:
CA Virtual Assurance leverages the following existing technologies:
The following diagram displays the product architecture:
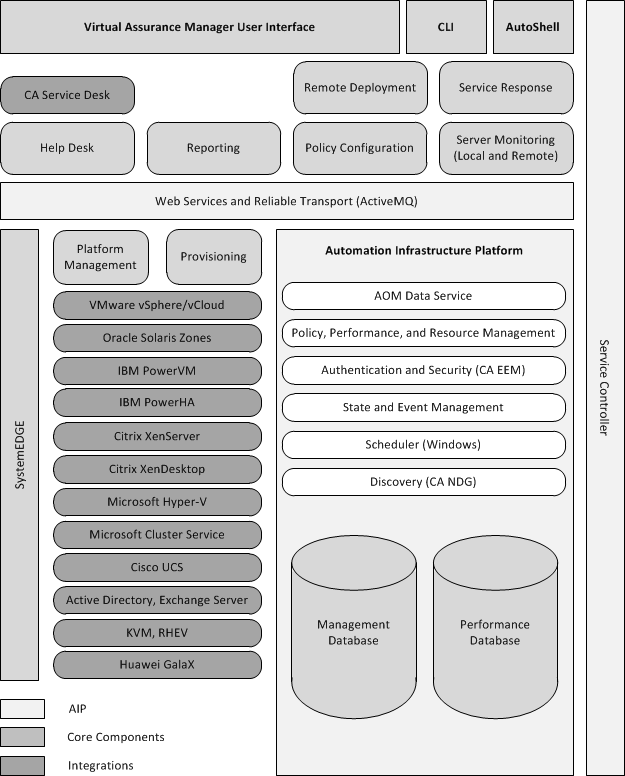
Each component registers with the service controller on startup. The service controller is a central component for identifying the location and status of all components. After a component is registered, it provides its Web Services Description Language (WSDL) location and publishes its events for other components to subscribe to and receive real-time notification of changes to the data center.
The Provisioning component provides provisioning capabilities for vCenter Server, Hyper-V, and Solaris Zones. Additionally, you can remotely deploy SystemEDGE and the AIMs provided by CA Virtual Assurance to remote servers.
The Resource Manager component is responsible for updating all resources in the product, such as creating and updating user-defined services.
The Initiation component provides integration with Microsoft Scheduler for job scheduling. Long running maintenance tasks and actions can be scheduled as jobs, for example.
CA EEM is used for all security and role-based management.
CA Virtual Assurance Event Manager captures all events generated by CA Virtual Assurance components and provides SNMP forwarding. SNMP forwarding can be used to forward events to any CA or third-party product capable of receiving SNMP traps.
The Policy component analyzes the collected data.
The Performance Monitor component integrates with SystemEDGE to collect system performance data. SystemEDGE must be installed on any server from which you want to collect the base system metrics, unless you are using the Remote Monitoring AIM to monitor Windows servers remotely without installing any additional software on them (zero footprint). All performance metrics are stored in the Performance Database.
After the Management DB is populated with the managed servers, the Performance Monitor begins gathering information to determine if the servers can collect performance metrics.
The Policy component analyzes the collected data to determine which user-defined business rules have been breached, and runs actions on the target servers or services. You define the rules and actions to resolve a particular problem in advance. The policy component uses your parameters to make intelligent decisions. After the server or service is identified, you can perform various actions to resolve the situation. For example, run custom scripts, provision new systems, and more.
Finally, you can monitor the data center performance through graphs and charts directly from the graphical user interface or through reports generated by CA Virtual Assurance. CA Virtual Assurance lets you also view its current component status, configure components, validate settings, or create user access lists.
|
Copyright © 2013 CA.
All rights reserved.
|
|