

Implementation Guide › Configuring Event Collection › Example: Enable Direct Collection Using the ODBCLogSensor
Example: Enable Direct Collection Using the ODBCLogSensor
You can enable direct collection of events generated by specific databases and CA products with the ODBCLogSensor. To do this, you create a connector on the default agent that is based on an integration that uses the ODBCLogSensor. Many integrations use this sensor, for example, CA_Federation_Manager, CAIdentityManager, Oracle10g, Oracle9i, and MS_SQL_Server_2005.
Following is a partial list of products that generate events that can be collected directly by the default agent on a CA User Activity Reporting Module server. For each product, a unique connector is used; each connector uses the ODBCLogSensor.
- CA Federation Manager
- CA SiteMinder
- CA Identity Manager
- Oracle 9i and 10g
- Microsoft SQL Server 2005
For a complete list, see the Product Integration Matrix on Support Online.
This example shows how to enable direct collection of events from a Microsoft SQL Server database. The connector deployed on the default agent is based on the MS_SQL_Server_2005 integration. In this example, the SQL Server database resides on an ODBC server. The connector deployed to the CA User Activity Reporting Module agent collects events from the MSSQL_TRACE table. Part of enabling the collection of events from a Microsoft SQL Server database is to direct selected events to this trace table. You can find explicit directions for doing this in the CA Connector Guide for Microsoft SQL Server.
To learn how to configure the Microsoft SQL Server event source
- Select the Administration tab and the Library subtab.
- Expand Event Refinement Library, expand Integrations, expand Subscription, and select MS_SQL_Server_2005.
The View Integration Details displays the sensor name, ODBCLogSensor. Supported platforms include both Windows and Linux.
- Click the Help link on View Integration Details.
The Connector Guide for Microsoft SQL Server appears.
- Review the Prerequisites and Microsoft SQL Server Configuration sections for guidelines.
To configure the event source and verify logging
- Gather the following details: the IP address of the ODBC server, the database name, the Administrator user name and password required to log on to the server, and the credentials of the low-privileged user used for SQL Server authentication. (This is the user defined to have read-only access to the trace table.)
- Log on to the ODBC server with the Administrator user name and password.
- Ensure connectivity over TCP/IP as specified in the Connector Guide for Microsoft SQL Server.
- Configure the SQL Server and verify that events are being directed to the trace table as specified in the Connector Guide for Microsoft SQL Server.
Note: Keep a record of the name of the database under which you create the trace table. You must specify that database name in the connection string. For example: master.
To create a connector on the default agent to retrieve events generated by a SQL Server database on an ODBC Server
- Select the Administration tab and the Log Collection subtab.
- Expand Agent Explorer, and expand the agent group containing the CA User Activity Reporting Module default agent
- Select a default agent, that is, an agent with the name of a CA User Activity Reporting Module server.
The default agent can have other connectors deployed to it.
- Click Create New Connector.
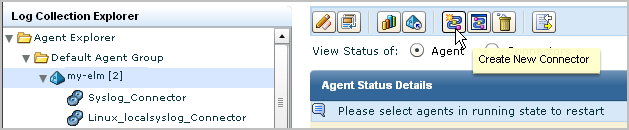
The New Connector Creation wizard opens with the Connector Details step selected.
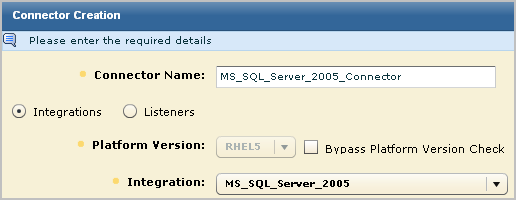
- Select the MS_SQL_Server_2005 integration from the Integration drop-down list.
This selection populates the Connector Name field with MS_SQL_Server_2005_Connector.
- (Optional) Replace the default name with one that makes the connector easy for you to identify. Consider providing a unique name if you are monitoring several SQL Server databases with this same agent.
- (Optional) Click the Apply Suppression Rules step and select rules associated with the supported events.
For example, select MSSQL_2005_Authorization 12.0.44.12.
- Click the Connector Configuration step and click the Help link.
Instructions include CA Enterprise Log Manager Sensor Configuration Requirements for both Windows and Linux.
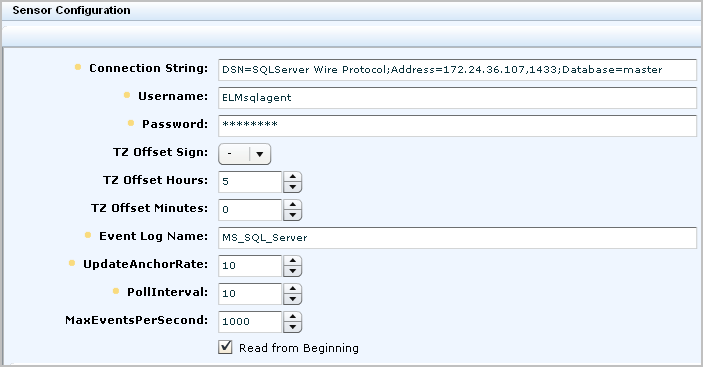
- Review the steps for Linux, the platform of the default agent, and configure the Connection String and other fields as specified.
- Enter the connection string as specified under Sensor Configuration--Linux, where the address is the host name or IP address of the event source and the database is the SQL Server database under which MSSQLSERVER_TRACE is created.
DSN=SQLServer Wire Protocol;Address=IPaddress,port;Database=databasename
- Enter the name of the user with read-only event collection access rights. This user must be assigned the db_datareader and public roles to have read-only access.
- Enter the password for the specified Username.
- Specify the timezone of the database as an offset of GMT.
Note: On a Window server, this information appears on the Time Zone tab of Date and Time Properties. Open the clock on the system tray.
- Select or clear Read from Beginning depending on whether you want the log sensor to read events from the beginning of the database.
A partial example follows:
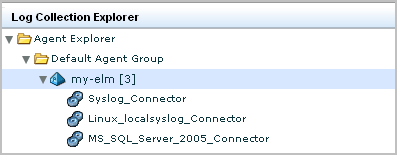
- Click Save and Close.
The new connector name displays under the agent in the Agent Explorer.
- Click the MS_SQL_Server_2005_Connector to view status details.
Initially, the status shows Configuration pending. Wait until that status shows Running.

- Select the connector and click Running to see event collection details.
Note: You can also run a report to view data from this database.
To verify that the default agent is collecting events from the target event source
- Select the Queries and Reports tab. The Queries subtab is displayed.
- Expand Prompts in the Query List and select Connector.
- Enter the connector name and click Go.
Collected events are displayed. The first two are internal events. Those that follow are events collected from the MS SQL trace table you configured.
Note: If the expected events are not displayed, click Global Filters and Settings in the main toolbar, set the Time Range to No Limit, and save the setting.
- (Optional) Select Show raw events and examine the result string for the first two event. The result string appears last in the raw event. The following values indicate a successful start.
- result_string=ODBCSource initiated successfully - MSSQL_TRACE
- result_string=<connector name> Connector Started Successfully
More information:
Event Sources for Direct Log Collection
Copyright © 2013 CA.
All rights reserved.
|
|