

CA SRM can display object data in a table, as a graph, or as a list of objects. If you save historical information for an object, then you can also display the object data as a trend report. Each object listed in the CA SRM Object Tree has a data view associated with it. The default view is the table format.
When you select an object from the Object Tree, CA SRM displays the object according to the view currently set for it. The following example shows the Volumes table:
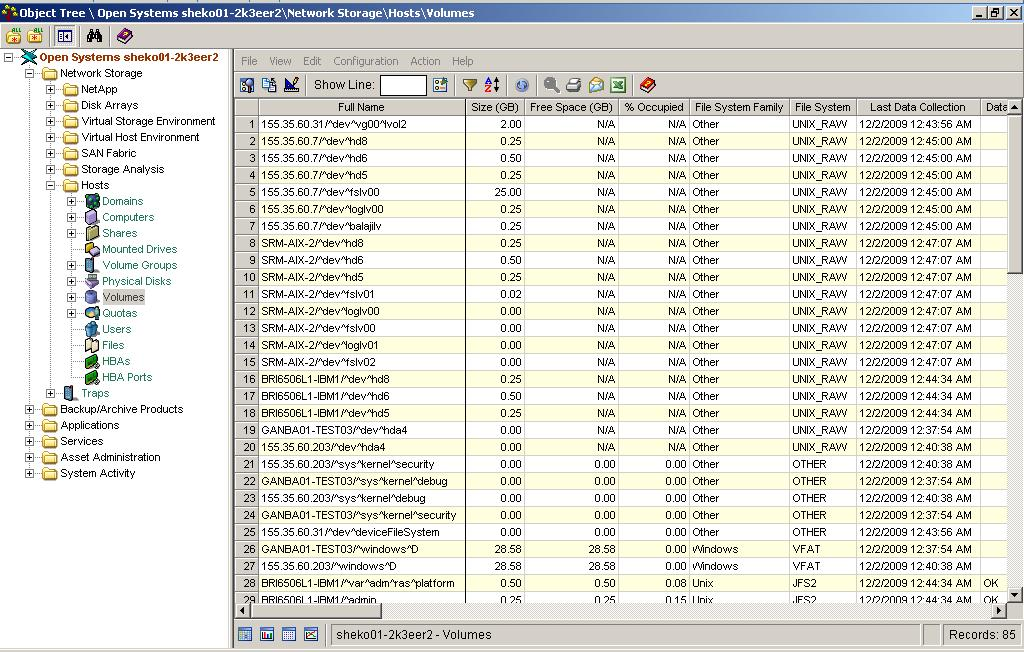
When the information displays, you can customize your view of the data. The following view shows the same information, shown previously but in a graph:
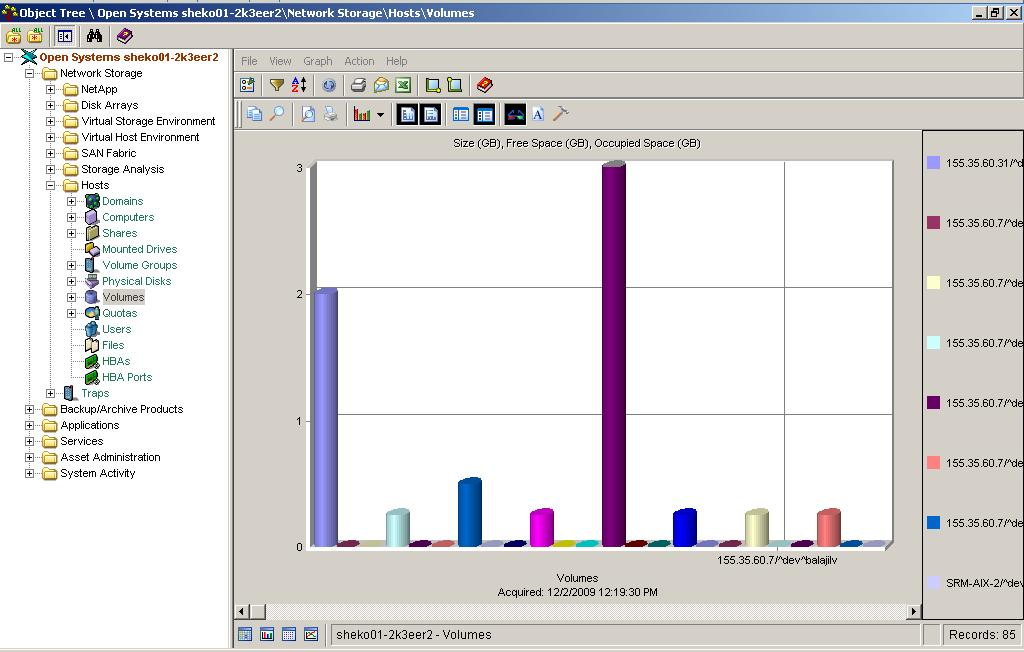
You can also sort and filter the information to focus on a list of objects, rearrange objects in a meaningful order, or collect historical data and create trending reports for objects about which trend information has been collected.
CA SRM provides a variety of display options. You can:
|
Copyright © 2016 CA Technologies.
All rights reserved.
|
|