

User Views › Object Menu Bar › Operate Menu › Monitor Mode
Monitor Mode
For z/OS systems, the Windows Client can display the object tables in two modes:
- In the default Static mode, this gives you a fixed point-in-time snapshot of your object data.
- In the dynamic Monitor mode, this gives you a regularly refreshed, historical view of your object data.
You can export each snapshot of the monitored rows to a workstation log file. The setting remains in effect as long as the table displays in Monitor mode.
When you save your Monitor view, you automatically save your settings for Monitor mode. If you save the view of the object table with Monitor mode enabled, then the table displays in Monitor mode the next time you select this view.
Monitor mode provides the basis for graphic monitoring of an object. For example, you can start Monitor mode in the Volumes table, then define a real‑time graph for this view. The Windows Client updates the graph automatically according to the time interval you specified and for as long as the table remains open, even if you minimize the table. If you close the table, the system ceases to update the data.
When a table displays in Monitor mode, its Execute button is disabled (dimmed).
You specify the rows that you want monitored by specifying:
- The time interval between updates, in minutes
- The first row you want processed
- The number of rows you want processed (including the first row)
For example, if you want to monitor the first five rows of your object table on a minute-by-minute basis, you would enter 1 in the Time interval in minutes field, 1 in the First row to process field, and 5 in the Number of rows to process. If you wanted to monitor the seventh row of you object table every half hour, you would enter 30 in the Time interval in minutes field, 7 in the First row to process field, and 1 in the Number of rows to process field.
To start the Monitor Mode function
- Select Monitor from the View menu of the table, the Monitor dialog is displayed:
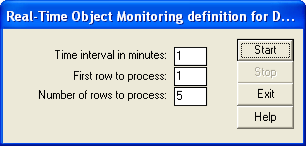
- In the Time Interval in minutes: field, specify the number of minutes after which the display is to be updated. For example, if you want to monitor an object on a minute-by-minute basis, you enter 1; if you want to monitor an object an hourly basis, you enter 60.
- In the First row to process: field, define the starting row for the range of rows to monitor in the corresponding text box. For example, if you want to start processing with the first row, you enter 1; if you want to start processing with the second row, enter 2.
- In the Number of rows to process: field, specify the range of rows and the number of rows in the corresponding text box. For example, if you want to process the first five rows, enter 5; if you want to process the first twenty rows, enter 20.
- Click the Start button. The Monitor dialog closes, and the table display is dynamically updated according to the parameters you specified.
To stop monitoring
- Select Monitor from the View menu of the table, the Monitor dialog is displayed.
- Click Stop, and then Exit. The Monitor dialog closes and the Execute button is enabled.
Copyright © 2013 CA.
All rights reserved.
|
|