

Use the following Graph toolbar options to manipulate the appearance and output format of your graph.
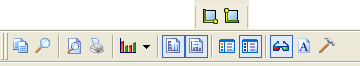
The Graph toolbar provides you with these tools for working with graphs:
|
Icon |
Function |
|---|---|
|
|
X-axis Source lets you select the source attributes for the X‑axis. These attributes are text labels, such as object name or type of operating system. |
|
|
Y-axis Source lets you select attributes for the Y‑axis. These attributes can be numeric fields from the object. Selectable items vary depending on the object. |
|
|
Copy lets you copy your graph to the clipboard as a bitmap, metafile, text, or OLE file. You can then paste the graph from the clipboard into a variety of Windows applications (word processor, email, spreadsheet, and so on). |
|
|
Zoom lets you zoom on data you specify. Click Zoom, then click and hold the mouse button to zoom on an area of interest. You can also hold the mouse button and drag the cursor across the chart to create a box around the area you want to view. When you release the mouse button, you zoom on the specified data. To return to the original view, click Zoom again. |
|
|
Print Preview lets you adjust your graph prior to printing. For example, you can print the graph with a legend that is separate from the rest of the graph, or indicate to print the graph with colors even if you will be printing on a black and white printer (useful for gray scale printing). You can manually scale the graph image using scaling handles on the top and bottom of the image and you can click and drag the graph image to a different location on the page. |
|
|
Print Report lets you configure print specifications and print your report. |
|
|
Graph Gallery lets you select from 16 graph styles that you can apply to a User View. Styles include line, bar, area, Gant, and so on. To select a graph style, click the down arrow next to the styles icon, then select a style. |
|
|
Vertical Grid is a toggle control that lets you display or remove the vertical scale lines from your graph. |
|
|
Horizontal Grid is a toggle control that lets you display or remove the horizontal scale lines from the graph. |
|
|
Legend Box is a toggle control that lets you display or remove the graph legend from the graph. |
|
|
Values Legend is a toggle control that lets you display or remove the values legend from the graph. |
|
|
2D and 3D Views is a toggle control that lets you display the graph as a three‑dimensional image suggesting depth through shading or as a flat two‑dimensional image. |
|
|
Fonts lets you modify the fonts and font sizes used on text areas of the graph (titles, labels, legends, and data editor, and so on). Select a text type to edit and the Text Editor dialog is displayed from which you can select fonts and font sizes. |
|
|
Tools lets you display or hide the Tools toolbar, the Values and Series legends, and the Data Editor. To redisplay the Tools toolbar, right‑click the graph and select Toolbar from the pop-up menu. |
|
Copyright © 2013 CA.
All rights reserved.
|
|


