

This section contains the following topics:
The CA SiteMinder® OneView Monitor identifies performance bottlenecks and provides information about resource usage in a CA SiteMinder® deployment. It also displays alerts when certain events, such as component failure, occur. It does this by collecting operational data from the following CA SiteMinder® components:
As these components are added to a CA SiteMinder® deployment, they are automatically registered with OneView Monitor. You do not need to configure OneView to monitor these components.
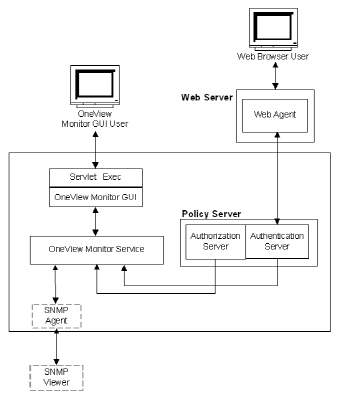
Each machine that hosts a monitored component includes a OneView agent. The agent sends operational data to the OneView Monitor, which resides on the machine where the Policy Server is installed. The OneView Monitor sends the operational data to a Web browser or (optionally) an SNMP agent. The SNMP agent sends the data to the SNMP manager.
OneView Monitor data can be accessed from a Web browser, or from a third-party SNMP monitoring application.
The following graphic illustrates how the OneView Monitor is integrated in a CA SiteMinder® deployment.
The OneView Monitor collects properties, such as the IP address of the component’s host machine, and counters that reflect a component’s activity, such as how many times users have logged into your site. Counters are reset when the component is restarted.
Using the Web-based OneView viewer, administrators can define tables to view some or all of the data for a specific component. The data is refreshed at configurable intervals.
SNMP support enables monitoring applications to retrieve operational data from the OneView Monitor. SNMP support includes a Management Information Base (MIB) and an SNMP agent.
Note: In an environment that includes a clustered Policy Servers, you can specify a single OneView Monitor to monitor activity on all Policy Servers in a cluster. To configure a central monitor, you must adjust the OneView Monitor settings in the Policy Server Management Console for each Policy Server in the cluster.
The following lists and describes Policy Server data:
Table of agents that are connected to this server.
Note: AgentTable is not available using SNMP.
Number of successful authentications.
Number of failed authentication attempts. These attempts failed because of invalid credentials.
Number of successful authorization attempts.
Number of rejected authorization attempts. These attempts were rejected because of insufficient access privileges.
Number of find operations in the authorization cache. Updated each time an authorization process asks whether a user belongs to a policy.
Number of authorization cache find operations occurring per second.
Number of hits on the authorization cache. Updated each time the cache answers true when an authorization process asks whether a user belongs to a policy.
Number of hits on the authorization cache occurring per second.
Number of authorization cache misses because an element is found in the cache but considered too old.
Path of the Policy Server, which uniquely identifies the server. The component path includes the following information:
Note: Component Path is not available using SNMP.
Length of the encryption key used to encrypt/decrypt data sent between the Web Agent and the Policy Server.
The ratio of authorization cache hits to authorization find operations. This is an indicator of authorization cache effectiveness.
IP address of the machine where the authentication server is installed.
Note: The Host IP address is included in the Component Path.
Number of IsProtected calls received from an Agent.
Policy Server build number.
Date and time of the Policy Server’s last interaction with the Monitor.
Maximum number of Web Agent sockets available to submit concurrent requests to a Policy Server.
Maximum number of worker threads in the thread pool.
Maximum number of worker threads from the thread pool ever used.
Number of entries in the priority queue. The priority queue holds entries of high priority. See ServerQueueLength.
Operating system of the machine where the Policy Server is installed.
Indicates whether the policy cache is enabled.
Policy Server port number.
Policy Server product name.
Number of entries in the normal queue. The normal queue holds entries of normal priority. See PriorityQueueLength.
Number of open sockets, which corresponds to the number of open connections between the Policy Server and Web Agents.
Status of the Policy Server. The status can be Active or Inactive.
Inactive status indicates that there was no interaction between the Policy Server and the monitor for a specified period of time. The period of time is determined by the heartbeat interval.
Number of a worker threads that are available from within the thread pool. All worker threads, which process requests, are organized into a thread pool. Not all threads are busy immediately--only when enough load is applied. This value shows how many threads are not currently busy.
Number of worker threads from the thread pool that are in use.
Time zone for the geographical location where the Policy Server is installed.
Type of Policy Server.
The startup time of the Policy Server.
Indicates whether the user authorization cache is enabled.
Version number of the most recently applied update.
Version number of the Policy Server.
The following lists and describes Web Agent data:
Indicates the average time it takes to authorize a user (in milliseconds).
Number of authorization attempts made by this Agent. An authorization attempt occurs when a user supplies credentials to the Policy Server in order to access a protected resource.
Number of errors that occurred during authorization attempts made by this Web Agent. An error indicates a communication failure between the Web Agent and Policy Server during an authorization call.
Number of failed authorization attempts. An authorization attempt fails when a user lacks sufficient privileges to access a resource.
Number of cookies that the Web Agent could not decrypt.
Number of requests that the Agent refuses because of bad URL characters. Bad URL characters are specifically blocked to prevent a Web client from evading SiteMinder rules. These characters are specified in the Web Agent’s configuration.
Path of the Web Agent. The component path includes the following information:
Note: Component Path is not available using SNMP.
Number of cross-site scripting hits. A cross-site scripting hit consists of malicious code embedded in pages at your site.
Note: For more information about cross-site scripting, see the Web Agent Configuration Guide.
Length of the encryption key used to encrypt/decrypt data sent between the Web Agent and the Policy Server.
Number of requests that contained an expired cookie.
IP address of the machine where the Web Agent is installed.
Note: The Host IP address is included in the Component Path.
The average amount of time it takes (in milliseconds) for the Web Agent to determine from the Policy Server whether or not a resource is protected.
Number of times the Web Agent has checked the Policy Server to see if a resource is protected.
Note: If the resource cache is set to 0, the OneView Monitor may record two or more IsProtected calls per login attempt. If the Web Agent is not caching information, it must check with the Policy Server to determine whether or not a resource is protected each time a request is made to the Web server.
If the resource cache is not set to 0, the OneView Monitor only records one IsProtected call. In this case, the Web Agent makes one IsProtected call to the Policy Server; subsequent requests to the Web server for the same resource are satisfied against the Web Agent’s resource cache until the resource in the cache expires or the resource cache is flushed.
Number of times an error has occurred when the Web Agent asks the Policy Server whether or not a resource is protected. An error indicates a communication failure between the Web Agent and the Policy Server.
Web Agent build number.
Date and time of the Web Agent’s last activity.
Average time it takes for a user to log in.
Number of login attempts made from this Web Agent.
Number of errors that occurred during login attempts. An error indicates a communication failure between the Web Agent and the Policy Server.
Number of failed login attempts. Login failures occur when users supply invalid credentials.
Name of the Web Agent.
Operating system of the machine where the Web Agent is installed.
Web Agent product name.
Number of entries in the resource cache. The resource cache stores information about recently accessed resources to speed up subsequent requests for the same resource.
The number of entries in the resource cache can be 0 to n, where n is the maximum cache size specified in the Web Agent’s configuration.
Number of times that the Web Agent located a resource in the resource cache. This number indicates how frequently SiteMinder is using cached resources.
The maximum number of entries the resource cache can contain. This number is specified in the Web Agent’s configuration.
Note: Details on setting the resource cache size exist in the Web Agent Configuration Guide.
Number of open sockets, which corresponds to the number of open connections between the Policy Server and the Web Agent.
Note: Because the Web Agent architecture has changed, SocketCount has no value.
Status of the Web Agent. The status can be Active or Inactive.
Inactive status indicates that there was no interaction between the Web Agent and the monitor for a specified period of time. The period of time is determined by the heartbeat interval.
Time zone for the geographical location where the Web Agent is installed.
Type of monitored component. In this case, the Web Agent.
The startup time of the Web server where the Web Agent is installed.
Version number of latest software update.
Number of entries in the user session cache. The user session cache stores information about users who have recently accessed resources. Storing user information speeds up resource requests.
The number of entries in the user session cache can be 0 to n, where n is the maximum cache size specified in the Web Agent’s configuration. see the Web Agent Configuration Guide for information on setting the user session cache size.
Note: The user session cache count may differ based on the Web server where the session cache is located.
For Web Agents that use multi-thread cache, such as IIS Web Agents, iPlanet 4.x and 6.0 Web Agents (on Windows operating systems), and Domino Web Agents (on Windows and UNIX operating systems), the OneView Monitor increases the user session cache count when a user is successfully authenticated and receives a session cookie from the Web Agent.
Apache and iPlanet 4.x and 6.0 Web Agents running on UNIX operating systems, which use multi-process cache, count sessions differently. A user’s session is not added to the session cache until he presents a session cookie to the Web Agent. The Web Agent creates a session cookie for the user after he is successfully authenticated. SiteMinder uses that cookie to authenticate the user if he makes additional resource requests. This means that the user’s first login is not recorded in the user session cache count. If the user makes another request and SiteMinder authenticates the user using the session cookie, the user session cache count increases.
In all Web Agents, the user session is valid for resources in one realm. If the user accesses a resource in a different realm using a session cookie, he is given another user session, which increases the user session cache count.
Number of times that Web Agent accessed the user session cache.
The maximum number of entries the user session cache can contain. This number is specified in the Web Agent’s configuration.
Note: Details on setting the user session cache size exist in the Web Agent Configuration Guide.
The number of times the Web Agent could not locate user session information in the user session cache. This occurs when:
Average amount of time it takes to validate a cookie used to authenticate a user (in milliseconds). Cookies may be used to authenticate a user in a single sign-on environment.
The number of times a specific Web Agent attempted to validate a session cookie against the Policy Server to authenticate a user, instead of matching that user’s credentials to a user directory entry. (The Web Agent creates a session cookie on the user’s browser when a user is successfully authenticated, and uses that cookie to authenticate the user on subsequent requests for new resources.)
The following conditions affect the ValidationCount:
If a Web Agent’s user session cache is set to a value greater than 0, the user’s session information is stored in the cache. The Web Agent validates the session against the session cache instead of the Policy Server, so the ValidationCount does not increase. If the user session cache is set to 0, the ValidationCount increases each time a user requests a protected resource because the Web Agent must validate the session against the Policy Server.
Web Agents that use multi-threaded cache, such as IIS Web Agents, iPlanet 4.x and 6.0 Web Agents (on Windows operating systems, and Domino Web Agents (on Windows and UNIX operating systems), add a session to the session cache (if the session cache size is greater than 0) when a user is successfully authenticated. If that user requests additional resources from the same realm, the Web Agent validates the user against the session cache, so the ValidationCount does not increase.
Apache and iPlanet 4.x and 6.0 Web Agents running on UNIX operating systems, which use multi-process cache, do not add the session cookie to the session cache until the user presents the cookie to the Web Agent during a request for another resource in the realm where she was authenticated. The Web Agent validates the first request made with a session cookie against the Policy Server, which increases the ValidationCount. Subsequent requests are validated against the cache.
The number of errors that occurred when the Web Agent attempted to validate a user session. Errors indicate a communication failure between the Web Agent and the Policy Server.
The number of times the Web Agent has failed to validate a user session because of an invalid session cookie.
Version number of the Web Agent.
Configuring the OneView Monitor includes:
You can change how often data is sent between the OneView Monitor and a monitored component by modifying the following settings:
To modify the default values
Note: The value for these properties is specified in seconds.
The One View Monitor uses the following default port numbers:
Note: When the default port is used, the OneView Agent only listens on that port. If the default port is changed, the One View Agent listens on port you specify, and connects to the same port on the remote host you specify. For example, if you change the port to 55555, the OneView Agent listens on port 55555, and connects to port 55555 on the remote host.
To change the default port numbers
nete.conapi.service.monagn.port=port_number
nete.conapi.service.monagn.host=fully_qualified_domain_name_of_remote_host
nete.conapi.service.mon.port=port_number
Note: For more information about the properties in conapi.conf, see the notes in the conapi.conf file.
In a non-clustered CA SiteMinder® deployment, a Monitor process is located on the same system as the Policy Server. The Monitor user interface and the SNMP provide information for a single Policy Server. To monitor a cluster, the Policy Servers in the cluster must be configured to point to a single Monitor process. The Policy Server Management Console allows you to specify a Monitor process host.
Consider the following when implementing a monitoring in a clustered environment:
Note: By not enabling clustering, all servers are in the default cluster. Centralized monitoring can be enabled for non-clustered environments.
Be sure the OneView Monitor service is running before you access the OneView viewer.
To access the OneView viewer, enter the following URL in a browser:
http://your_server.your_company.org:port/sitemindermonitor
where your_server.your_company.org:port is the host name or IP address, and the port number of the Web server which is configured for the OneView Monitor.
Note: For instructions on configuring a Web server for the OneView Monitor, see the Policy Server Installation Guide.
To protect the OneView viewer, create a CA SiteMinder® policy that protects the resources in sitemindermonitor.
OneView Monitor provides the following default tables:
The All Components table is displayed when you open OneView.
Note: A Web Agent installed on an Apache or iPlanet 6.0 Web server will not appear in the OneView viewer until that Web Agent asks the Policy Server if a resource is protected. When the Web Agent requests information from the Policy Server, it is registered with the OneView Monitor.
The OneView viewer displays operational data in configurable tables. A table may contain a Details column. Clicking an icon in the Details column opens a window that displays all the monitored data for a particular component.
Customizing OneView displays includes:
Set Up Tables
To set up tables
The Table Configuration dialog box opens.
Note: The value for some of the fields can be displayed as a continuously increasing number (reset when the component is restarted) or as an average since the last update period. To view the average value, select a field name with /sec appended to it.
Note: Make sure to save the table after configuring it.
Configure Alerts
To configure alerts
Display Tables
To display tables, select a table from the View Table list box in the main viewer page. When you select a table from this list, OneView displays the selected table below the existing table.
To hide a table, click the Hide button.
Sort Tables
You can sort the data in each column in a table in ascending or descending order. Sorting columns helps organize a table. For example, sorting a table based on Status enables you to view all inactive components grouped together.
Note: An arrow in the column heading indicates which column is sorted.
Configure Data Updates
By default, OneView updates data every thirty seconds. You can:
To configure data updates
CA SiteMinder® opens the Updates dialog box.
Save Settings
Saving a setting saves:
To save settings
CA SiteMinder® displays a dialog box where you can name the settings.
Change the Default Display
To change the default display
Load Settings
To load settings
CA SiteMinder® displays a dialog box where you can select settings to load.
|
Copyright © 2013 CA.
All rights reserved.
|
|