

This section contains the following topics:
How to Estimate a Sustained Request Rate
Other Factors to Consider When Capacity Planning
Planning a CA SiteMinder® Web Services Security deployment with performance in mind is the first step to maintaining high enterprise availability and performance standards. A good approach is to estimate the number of expected requests CA SiteMinder® must handle per web service. The following are the most significant factors that influence CA SiteMinder® performance:
Note: Each web service request triggers one authentication and one authorization event.
The following graphic illustrates how request rates fluctuate throughout the day, are sustained for a specific period, and peak within that period:
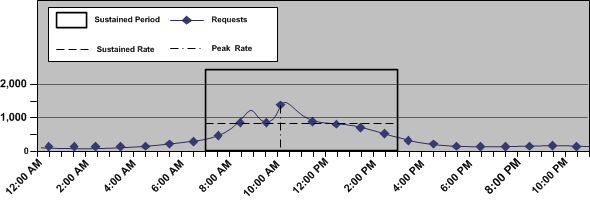
Note: Authenticating and authorizing requests results in a number of reads from a user store. Determining sustained and peak rates helps you determine the load under which your user stores must operate to service Policy Server requests.
The purpose of the following use case is to illustrate how example.com, a fulfillment service organization approaches capacity planning by modeling the usage of their order fulfillment web service. The use case is referenced throughout this chapter for examples.
The company is planning to deploy CA SiteMinder® Web Services Security to protect its web service. The company has 10,000 users in a single user store.
Some web service clients send a single status request to the inventory operation of the web service once a day while others may send as many as four batched order requests per day to the fulfillment operation.
Estimating the sustained request rate for a web service is the process of determining:
Complete the following steps to estimate the sustained request rate for a web service:
What is the estimated number of daily requests for the web service?
The number of web service clients directly affect daily requests (request load). When web service clients send a request to the web service, CA SiteMinder® authenticates them. Therefore, think of the request load of the web service as the total requests per day.
Note: When determining the request load, we recommend beginning with an evaluation interval of 24 hours. However, depending on the requirements of your enterprise, you can compare your daily results over a period of weeks or months to gain a better understanding of usage throughout the year.
All web service clients sending requests to the web service each day is unlikely, so estimating total requests begins with determining the percentage of web service clients that send a request once a day, which the following represents:
(total_clients * percentage_clients) * (number_of_requests) = daily_logins
Represents the total number of clients with access to the application.
Represents the percentage of clients that send requests the same number of times per day.
Represents the number of times the particular set of clients send requests.
Represents the number of logins the particular set of clients creates.
Example
The company has 10,000 users, 60 percent of which send an inventory status request once a day.
(10,000 * 0.6) x (1) = 6,000 logins
Additionally, 30 percent of users send one order fulfillment request per day, 20 percent of users send two order fulfillment requests a day, 10 percent send three order fulfillment requests a day, and 10 percent send four order fulfillment requests a day.
(10,000 * 0.3) x (1) = 3,000 logins
(10,000 * 0.2) x (2) = 4,000 logins
(10,000 * 0.1) x (3) = 3,000 logins
(10,000 * 0.1) x (4) = 4,000 logins
The total requests per day are the sum of each of the request calculations. The request load for the fulfillment web service is therefore 20,000 logins.
Note: The percentage of clients making requests is not necessarily equal to 100 percent because not all clients will necessarily send a request to the service each day.
The company uses the request load to estimate the sustained request rate.
What is the sustained request rate for the web service?
The sustained request rate is based on the request load. Specifically, when and at what rate the requests occur. The chance that the request load is uniformly spread across your business day is unlikely. Rather, the rate at which requests occur fluctuates, remaining between the lowest and highest (peak) levels for a sustained period. Estimating the sustained request rate is the process of identifying a sustained period during which the system is servicing an average number of requests.
When estimating a sustained request rate, we recommend using the daily request load to determine:
Note: We recommend beginning with an evaluation period of 24 hours, broken down into one-hour increments. However, depending on the requirements of your enterprise, you can compare your daily results over a period of weeks or months to gain a better understanding of usage throughout the year.
The following figure is an example of these metrics:
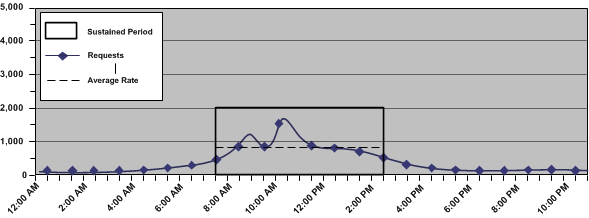
Identifying these metrics helps you to estimate the number of requests, per second, that CA SiteMinder® must service to maintain the average rate at which users authenticate, which the following represents:
(request_load * percentage_of_requests) / number_of_sustained_hours / 3600 = sustained_request_rate
Represents the number of daily requests for the application.
Represents the percentage of requests that occur when the system is operating at sustained levels.
Example: If the request load is 5,000 logins, and 3,000 logins occur during the sustained period, then the value is 64percent (0.64)
Represents the number of hours in which the system is operating at the sustained level.
Note: 3,600 represents the number of seconds in an hour.
Represents the number of requests, per second, that CA SiteMinder® must service during the period of sustained activity.
Example: Estimate the Sustained Request Rate
The company has determined that their web service has a request load of 2,000 logins. The web service is available to customers 24 hours a day, seven days a week. Using system activity reports to break down a typical day results in the following metrics:
(2,000 * 0.625) / 5 / 3600 = 0.0694 requests per second.
The fulfillment web service has a sustained request rate of 0.694 requests per second.
What is the peak request rate for the web service?
The peak request rate is based on the sustained request rate, specifically, when and at what rate the system is operating at peak levels. Estimating the peak request rate is the process of identifying when the system is servicing the highest level of requests.
When estimating the peak request rate, we recommend that you use the metrics you gathered when determining the sustained request rate to determine:
The following figure is an example of these metrics:
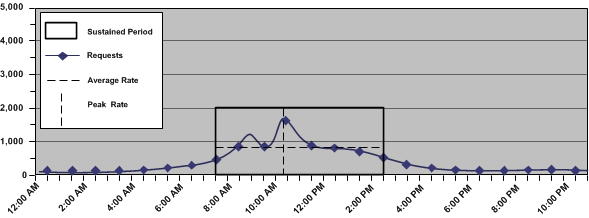
Identifying these metrics helps you to estimate the number of requests, per second, that CA SiteMinder® must service to maintain the peak rate at which web service clients authenticate, which the following represents:
(request_load x percentage_of_transactions) / number_of_hours / 3600 = peak_request_rate
Note: This rate is based on the single busiest hour. There can be periods when the peak request rate exceeds the hourly calculation.
Represents the number of daily requests for the web service.
Represents the percentage of transactions that occur when the system is operating at peak levels.
Represents the number of hours in which the system operates at peak levels.
Note: 3,600 represents the number of seconds in an hour.
Represents the peak request rate for the application.
Example: Estimate the Peak Request Rate
The company has determined that their web service has a daily request load of 8,800. System activity reports detail that during the single busiest hour of the day 1,800 requests occur. This number represents approximately 20 percent of the request load:
1,800 / 1 / 3600 = 0.5 requests per second
The fulfillment web service has a peak request rate of five requests per second.
Note: This example is based on the single busiest hour. There can be periods when the peak request rate during the hour exceeds five requests per second.
Although request rates are the most significant factors in CA SiteMinder® Web Services Security capacity planning decisions other factors can also influence CA SiteMinder® performance, in particular the authentication schemes used to protect your web services.
Also consider performance tuning and network bandwidth in your capacity planning process.
|
Copyright © 2013 CA.
All rights reserved.
|
|