Previous Topic: Finance Service ModelNext Topic: Service Modeling Example 2- Shopping Cart Service


Example Finance Service Escalation Flow

The modeled Finance service provides the necessary information to quickly detect and resolve issues that cause service degradation. Consider this simple service condition, displayed from the Topology view of the Operations Console as shown in the following graphic:

This graphic shows the FInance service with a red dotted line into the Database Group to the DBServer2 CI, which has a down condition.

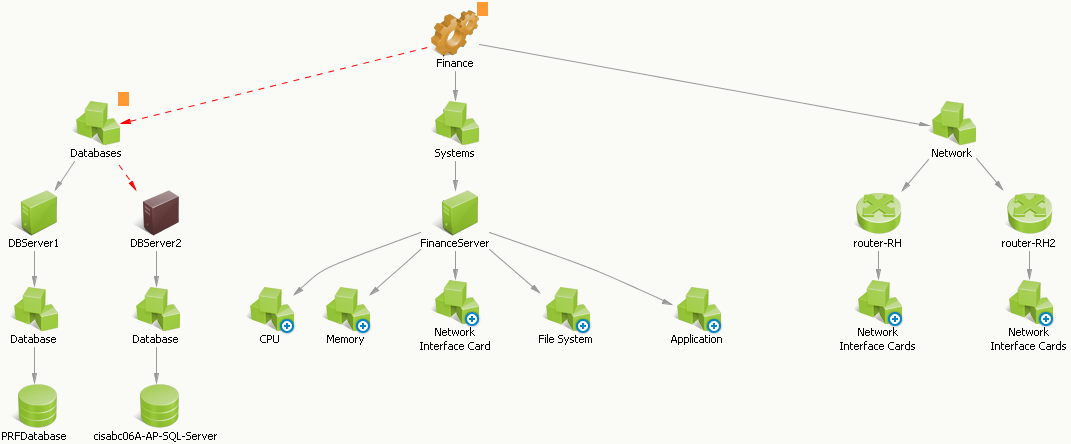
The conditions appear and are resolved as follows:

  1. Two alerts for DBServer2 appear in the Operations Console as shown in the following graphic:

    This graphic shows the Alerts tab of the Operations Console with two alerts opened on the DBServer2 CI: one Down alert for misconfigured buffers, and one Critical alert for Low memory.

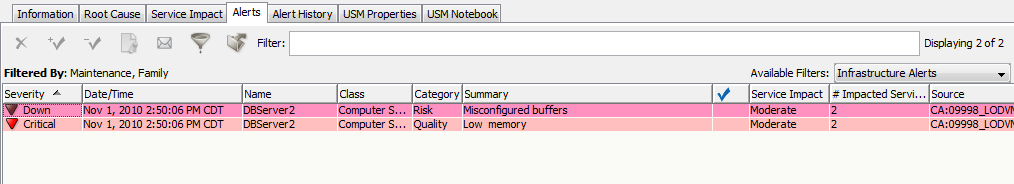
    These infrastructure alerts originated from the source domain manager (in this case, CA Insight DPM) and indicate Down and Critical alerts on the DBServer2 CI. If configured, escalation policies could perform specified actions on the alert, such as opening a help desk ticket or sending an email to a technician.

  2. The SA Manager calculates the impact on the Finance service, changes the Finance service status, and generates a service alert as shown in the following graphic:

    This graphic shows the Alerts tab in the Operations Console with one major service alert indicating the cause of service degradation.

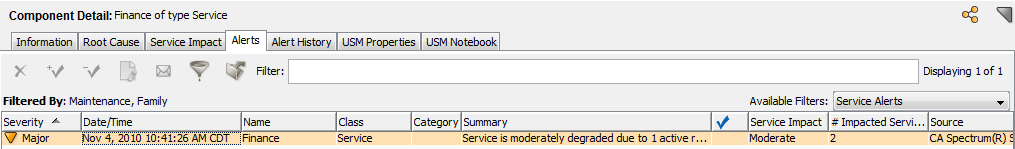
    The Major severity results from the service impact value of 20 as shown in the following graphic:

    This graphic shows a subset of the Finance service topology with an orange square next to the Database group and the Finance service containing the service impact value of 20.

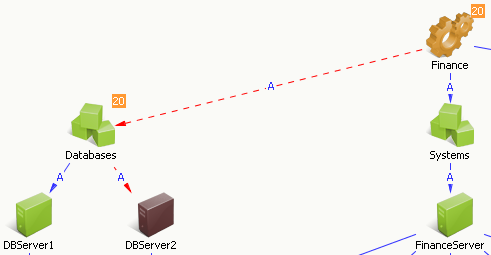
    CA SOI calculates the impact based on the severity of the root cause alert and the significance of the alerted CI. In this case, the root cause alert is the Down alert because it is a higher severity than the Critical alert, which is confirmed in the Root Cause tab. If other areas of the service had a similar severity with a higher CI significance (FinanceApp, for example), the service impact would be greater, and this condition would instead aggregate to the service level as the root cause condition.

  3. Service stakeholders can see a graphical view of all service conditions from the Dashboard as shown in the following graphic:

    This graphic shows the Finance service on the Dashboard, with Health, Quality, and Risk values displayed.

    Notice that service quality and risk are both affected, because the Down alert belongs to the Risk category, and the Critical alert belongs to the Quality category. Health is a reflection of the worst state held by quality or risk.

  4. To resolve the problem, the assigned technician right-clicks the alert to drill down into the source domain manager (in this case, CA Insight DPM) to learn more about the problems, if necessary.
  5. The assigned technician reconfigures the database server buffers, resolves the lack of free memory, and clears the infrastructure alerts.
  6. The alerts disappear from the Operations Console and the service condition returns to normal.