

|
|
|
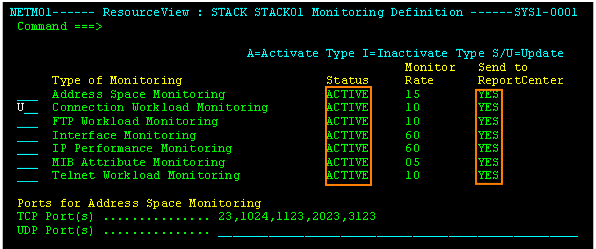
To produce stack reports, you must configure the correct type of monitoring to collect the type of data that you want. Configure the following type of monitoring for each type of data:
Configure Connection Workload Monitoring.
Configure FTP Workload Monitoring.
Configure Telnet Workload Monitoring.
Configure IP, TCP, and UDP Monitoring.
Configure Network Interface Monitoring.
Configure Address Space Monitoring.
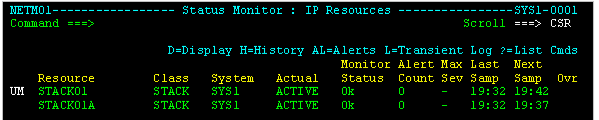
To access the stack monitoring definition
The IP Resource Monitor appears.
The Stack Monitoring Definition panel appears.
To select the type of stack monitoring
The Monitoring Definition attribute list panel appears.
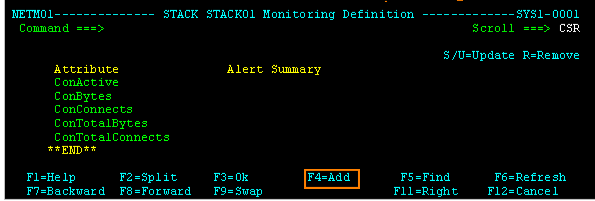
The Stack Monitoring Definition panel lists the attributes that will be monitored. Initially, only the attributes that are monitored by default are listed. You can add more attributes to the list.
Note: When you get to know what attributes are useful to you, and their typical values, you can return to this panel and enter U (Update) next to an attribute. This lets you set up alerts based on that attribute.
To add monitored attributes
The Selectable Attributes List panel appears. It shows all possible stack attributes that can be monitored by this monitoring type.
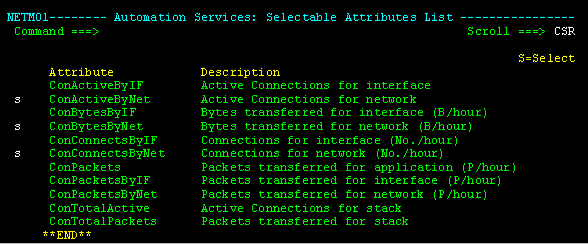
The names associated with stack data vary depending on the type of data.
Stack FTP or Telnet workload data is qualified with the names of the FTP users or Telnet applications used by the connections, and these names cannot be changed.
Unlike stack FTP or Telnet workload data, Stack connection workload data is qualified with the names of your business applications and these can be changed.
Business applications are logical groupings of connections that correspond with your site's usage and requirements. For example, you can associate all connections to Port 4440 with the NET4440 business application name.
You control how you want to map your connections to business application names by using the 3270 Maintain Application Name Definitions option (/IPADMIN).
By default, business application names correspond with the address space names.
For Stack Address Space Monitoring, enter and confirm the listener port numbers for this stack on the Stack Monitoring Definition panel.
| Copyright © 2012 CA. All rights reserved. |
|