

The Memory display contains memory statistics for analyzing a memory resource limitation is a cluster-wide manner.
An example of a resource Memory display is shown in the following illustration:
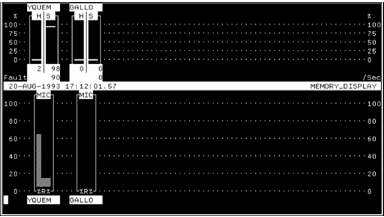
The top half of the memory display contains a bar graph for each cluster node currently set for display. The scale shown at right and left shows a percentage value ranging from 0 to 100%.
The name of the node is given at the top of an individual node graph, while the total page fault rate (faults per second) for the node is shown as a number at bottom right. Each node graph has two columns as follows:
|
Copyright © 2008 CA.
All rights reserved.
|
|