

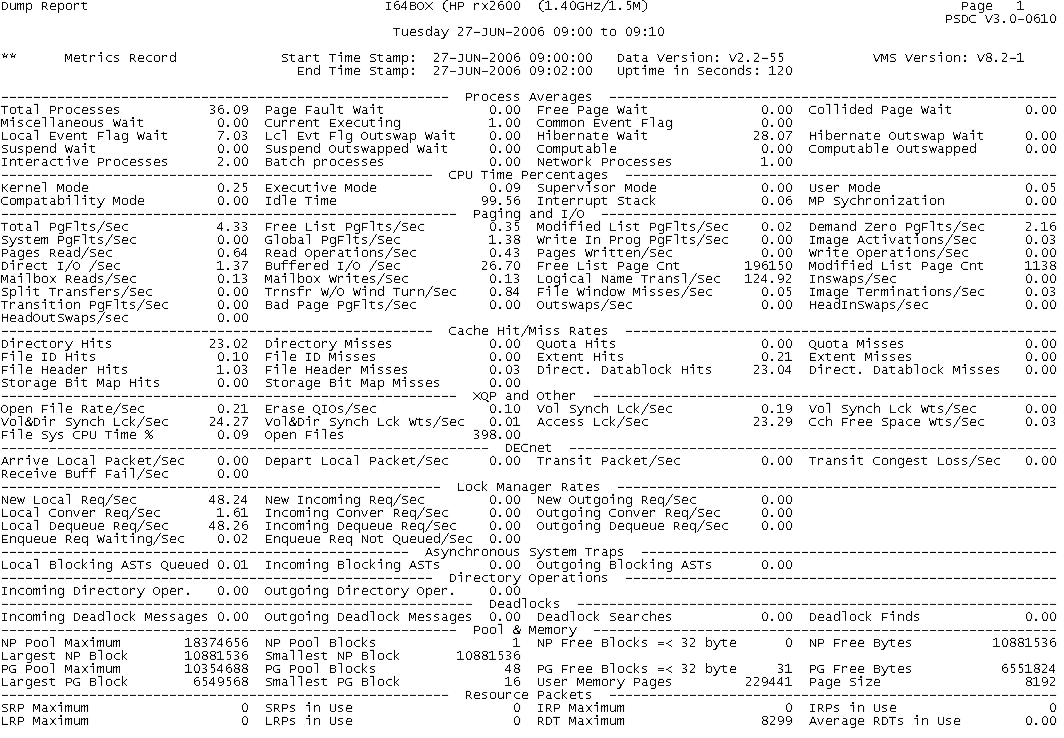
The following example shows a sample metrics record dump report. The table after the example describes the headings in the metrics record section of the dump report:
`
|
Item |
Description |
|
|---|---|---|
|
Total Processes |
The average number of processes for the given interval |
|
|
Page Fault Wait |
The average number of processes in the scheduler state PFW, (Page Fault Wait) |
|
|
Free Page Wait |
The average number of processes in the scheduler state FPW, (Free Page Wait) |
|
|
Collided Page Wait |
The average number of processes in the scheduler state COLPG, (Collided Page Wait) |
|
|
Miscellaneous Wait |
The average number of processes in the scheduler state MWAIT (Miscellaneous Wait) |
|
|
Current Executing |
The average number of processes in the scheduler state CUR |
|
|
Common Event Flag |
The average number of processes in the scheduler state CEF, (Common Event Flag wait) |
|
|
Local Event Flag Wait |
The average number of processes in the scheduler state LEF, (Local Event Flag Wait) |
|
|
Lcl Evt Flg Outswap Wait |
The average number of processes in the scheduler state LEFO, (Local Event Flag Wait Outswapped) |
|
|
Hibernate Wait |
The average number of processes in the scheduler state HIB, (Hibernate) |
|
|
Hibernate Outswap Wait |
The average number of processes in the scheduler state HIBO, (Hibernate Outswapped) |
|
|
Suspend Wait |
The average number of processes in the scheduler state SUSP, (Suspended) |
|
|
Suspend Outswapped Wait |
The average number of processes in the scheduler state SUSPO, (Suspended Outswapped) |
|
|
Computable |
The average number of processes in the scheduler state COM, (Computable) |
|
|
Computable Outswapped |
The average number of processes in the scheduler state COMO, (Computable Outswapped) |
|
|
Interactive Processes |
The average number of interactive processes. |
|
|
Batch |
The average number of batch processes. |
|
|
Network |
The average number of network processes. |
|
|
Kernel Mode |
Percentage of the CPU time used in Kernel Mode |
|
|
Executive Mode |
Percentage of the CPU time used in EXEC Mode |
|
|
Supervisor Mode |
Percentage of the CPU time used in Supervisor Mode |
|
|
User Mode |
Percentage of the CPU time used in USER Mode |
|
|
Compatibility Mode |
Percentage of the CPU time used in COMPAT Mode |
|
|
Idle Time |
Percentage of the CPU time spent idle |
|
|
Interrupt Stack |
Percentage of the CPU time spent processing interrupts |
|
|
MP Synchronization |
Percentage of the CPU time used in MP_SYNCH Mode |
|
|
Total PgFlts/Sec |
Average number of page faults per second |
|
|
Free List PgFlts/Sec |
Average number of page faults from the free list per second |
|
|
Modified List PgFlts/Sec |
Average number of page faults from the modified list per second |
|
|
Demand Zero PgFlts/Sec |
Average number of demand zero page faults per second |
|
|
System PgFlts/Sec |
Average number of system page faults per second |
|
|
Global PgFlts/Sec |
Average number of global page faults per second |
|
|
Write In Prog PgFlts/Sec |
Average number of write-in-progress page faults per second |
|
|
Image Activations/Sec |
Average number of image activations per second |
|
|
Pages Read/Sec |
Average number of pages read in from disk due to page faults per second |
|
|
Read Operations/Sec |
Average number of disk read I/Os due to page faults per second |
|
|
Pages Written/Sec |
Average number of pages written to page files, swap files, and mapped image sections per second |
|
|
Write Operations/Sec |
Average number of write I/O operations to page files, swap files, and mapped image sections per second |
|
|
Direct I/O /Sec |
Average number of direct I/O operations per second |
|
|
Buffered I/O /Sec |
Average number of buffered I/O operations per second |
|
|
Free List Page Cnt |
Average number of pages on the free list |
|
|
Modified List Page Cnt |
Average number of pages on the modified list |
|
|
Mailbox Reads/Sec |
Average number of mailbox read operations per second |
|
|
Mailbox Writes/Sec |
Average number of mailbox write operations per second |
|
|
Logical Name Transl/Sec |
Average number of logical name translations per second |
|
|
Inswaps/Sec |
Average number of in-swap operations per second |
|
|
Split Transfers/Sec |
Average number of split I/O operations per second |
|
|
Trnsfr W/O Wind Turn/Sec |
The number of times the executive I/O subsystem successfully maps a virtual to logical segment without needing to invoke XQP services per second |
|
|
File Window Misses/Sec |
The number of times the XQP updates the Window Control Block per second |
|
|
Image Terminations/Sec |
Average number of image terminations per second |
|
|
Transition PgFlts/Sec |
The number of transition state faults per second |
|
|
Bad Page PgFlts/Sec |
The number of page faults resolved from the bad page list |
|
|
Outswaps/Sec |
The number of process outswaps |
|
|
HeadInSwaps/Sec |
The number of process headers swapped in |
|
|
HeadOutSwaps/Sec |
The number of process headers swapped out |
|
|
Directory Hits |
The average number of times per second that directory file control blocks were found in the directory cache |
|
|
Directory Misses |
The average number of times per second that directory file control blocks were not found in the directory cache |
|
|
Quota Hits |
The average number of times per second that entries were found in the quota cache |
|
|
Quota Misses |
The average number of times per second that entries were not found in the quota cache |
|
|
File ID Hits |
The average number of times per second that file identifiers were found in the FID cache |
|
|
File ID Misses |
The average number of times per second that file identifiers were not found in the FID cache |
|
|
Extent Hits |
The average number of times per second that file extents were found in the extent cache |
|
|
Extent Misses |
The average number of times per second that file extents were not found in the extent cache |
|
|
File Header Hits |
The average number of times per second that file headers were found in the file header cache |
|
|
File Header Misses |
The average number of times per second that file headers were not found in the file header cache |
|
|
Direct. Datablock Hits |
The average number of times per second that directory data blocks were found in the directory cache |
|
|
Direct. Datablock Misses |
The average number of times per second that directory data blocks were not found in the directory cache |
|
|
Storage Bit Map Hits |
The average number of times per second that entries were found in the bitmap cache |
|
|
Storage Bit Map Misses |
The average number of times per second that entries were not found in the bitmap cache |
|
|
Open File Rate/Sec |
Average number of file opens per second |
|
|
Erase QIOs/Sec |
Average number of erase I/O operations per second |
|
|
Vol Synch Lck/Sec |
XQP volume synch lock operations per second |
|
|
Vol Synch Lck Wts/Sec |
The number of times the XQP had to wait for vol synch lock per second |
|
|
Vol&Dir Synch Lck/Sec |
XQP Directory and volume synch lock operations per second |
|
|
Vol&Dir Synch Lck Wts/Sec |
The number of times the XQP had to wait for a directory and vol synch lock, per second |
|
|
Access Lck/Sec |
The average XQP access lock rate per second |
|
|
Cch Free Space Wts/Sec |
The average number of times the XQP had to wait for cache free space per second |
|
|
File Sys CPU Time % |
Percentage of the CPU time used while executing in the file system |
|
|
Open Files |
The average number of open files. |
|
|
Arrive Local Packet/Sec |
DECNET arriving local packets per second |
|
|
Depart Local Packet/Sec |
DECNET departing local packets per second |
|
|
Transit Packet/Sec |
DECNET transit packets handled per second |
|
|
Transit Congest Loss/Sec |
DECNET transit congestion losses per second |
|
|
Receive Buff Fail/Sec |
DECNET receiver buffer failure rate |
|
|
New Local Req/Sec |
Average number of local lock ENQ requests per second managed by the local node |
|
|
New Incoming Req/Sec |
Average number of remote lock ENQ requests per second managed by the local node |
|
|
New Outgoing Req/Sec |
Average number of local lock ENQ requests per second managed by a remote node |
|
|
Local Conver Req/Sec |
Average number of local lock conversion requests per second managed by the local node |
|
|
Incoming Conver Req/Sec |
Average number of remote lock conversion requests per second managed by the local node |
|
|
Outgoing Conver Req/Sec |
Average number of local lock conversion requests per second managed by a remote node |
|
|
Local Dequeue Req/Sec |
Average number of local lock DEQ requests per second managed by the local node |
|
|
Incoming Dequeue Req/Sec |
Average number of local lock DEQ requests per second managed by a remote node |
|
|
Outgoing Dequeue Req/Sec |
Average number of local lock DEQ requests per second managed by a remote node |
|
|
Enqueue Req Waiting/Sec |
Average number of local lock ENQs or conversions per second that are placed in the wait queue |
|
|
Enqueue Req Not Queued/Sec |
Average number of local lock ENQs or conversions per second that are not granted and also not placed in the wait queue |
|
|
Local Blocking ASTs Queued |
Average number of local lock requests per second that trigger a blocking AST on the local node |
|
|
Incoming Blocking ASTs |
Average number of remote lock requests per second that trigger a blocking AST on the local node |
|
|
Outgoing Blocking ASTs |
Average number of local lock requests per second that trigger a blocking AST on a remote node |
|
|
Incoming Directory Oper. |
Average number of incoming lock directory functions per second |
|
|
Outgoing Directory Oper. |
Average number of outgoing lock directory functions per second |
|
|
Incoming Deadlock Messages |
Average number of incoming deadlock messages per second |
|
|
Outgoing Deadlock Messages |
Average number of outgoing deadlock messages per second |
|
|
Deadlock Searches |
Average number of deadlock searches per second |
|
|
Deadlock Finds |
Average number of deadlock finds per second |
|
|
NP Pool Maximum |
Average number of non-paged pool bytes, used and free |
|
|
NP Pool Blocks |
Average number of non-paged pool contiguous portions |
|
|
NP Free Blocks =< 32 byte |
Average number of free non-paged pool contiguous portions whose size is less than or equal to 32 bytes |
|
|
NP Free Bytes |
Average number of free non-paged pool bytes |
|
|
Largest NP Block |
The size of the largest non-paged pool contiguous portion |
|
|
Smallest NP Block |
The size of the smallest non-paged pool contiguous portion |
|
|
PG Pool Maximum |
Average number of paged pool bytes, used and free |
|
|
PG Pool Blocks |
Average number of paged pool contiguous portions |
|
|
PG Free Blocks =< 32 byte |
Average number of free paged pool contiguous portions whose size is less than or equal to 32 bytes |
|
|
PG Free Bytes |
Average number of free paged pool bytes |
|
|
Largest PG Block |
The size of the largest paged pool contiguous portion |
|
|
Smallest PG Block |
The size of the smallest paged pool contiguous portion |
|
|
User Memory Pages |
The number of physical pages less the system working set, non-paged pool, and lookaside lists |
|
|
Page Size |
Size of memory pages |
|
|
SRP Maximum |
Average number of small request packets, used and unused |
|
|
SRPs in Use |
Average number of small request packets in use |
|
|
IRP Maximum |
Average number of I/O request packets, used and unused |
|
|
IRPs in Use |
Average number of I/O request packets in use |
|
|
LRP Maximum |
Average number of large request packets, used and unused |
|
|
LRPs in Use |
Average number of large request packets in use |
|
|
RDT Maximum |
Average number of request descriptor table entries, used and unused |
|
|
Average RDTs in Use |
Average number of request descriptor table entries in use |
|
|
Lock ID Table Maximum |
Average number of lock ID table entries, used and free |
|
|
Lock IDs in Use |
Average number of lock ID table entries in use |
|
|
Resource Table Maximum |
Number of entries in the resource hash table |
|
|
Resources in Use |
Number of known resources |
|
|
Original Buffers |
Number of MSCP buffers |
|
|
Free Buffers |
Number of free MSCP buffers |
|
|
Smallest Buffer Allowed |
Minimum size of an MSCP buffer |
|
|
Free Pool Bytes |
Total number of free MSCP buffer bytes |
|
|
Buffer Wait Queue |
Average number of requests waiting for MSCP buffers |
|
|
Wait Queue Highwater Mark |
Maximum number of requests waiting for MSCP buffers |
|
|
Split Transfers/Sec |
Average number of requests per second that had to be split |
|
|
I/O Fragments/Sec |
Average number of contiguous portions of MSCP buffer space |
|
|
Operation Count/Sec |
Average number of MSCP I/O operations per second |
|
|
Read Count/Sec |
Average number of MSCP read I/O operations per second |
|
|
Write Count/Sec |
Average number of MSCP write I/O operations per second |
|
|
Total Paging Pages |
Total number of pages in all paging files |
|
|
Available Paging Pages |
Average number of free pages in all paging files |
|
|
Pagewait |
The percentage of time that the CPU was idle and at least one disk device had paging I/O in progress |
|
|
Swapwait |
The percentage of time that the CPU was idle and at least one disk device had swapping I/O in progress |
|
|
PSWPwait |
The percentage of time that the CPU was idle and at least one disk had either page I/O or swap I/O in progress |
|
|
CPUIOidle |
The percentage of time that the CPU and all disk devices were idle |
|
|
CPUonly |
The percentage of time that a CPU was busy and no disk device was busy |
|
|
IOonly |
The percentage of time that the CPU or all CPUs in a multiprocessor system were idle and at least one disk device was busy |
|
|
MultioIO |
The percentage of time that two or more of the disk devices were busy |
|
|
CPUIO |
The percentage of time that both the CPU and at least one disk device were busy |
|
|
VBSSCPU |
Average percent of CPU time in the Interrupt Stack spent on behalf of Virtual Balance Set Slot transitions only. |
|
|
Current Size |
Virtual I/O Cache free pages |
|
|
Maximum Size |
Virtual I/O Cache maximum size in pages |
|
|
I/O Reads/Sec |
Virtual I/O Cache read I/O rate |
|
|
Cache Rd Hits/Sec |
Virtual I/O Cache read hit rate |
|
|
Free Pages |
Number of Virtual I/O free pages |
|
|
In Use Pages |
Number of Virtual I/O pages in use |
|
|
I/O Writes/Sec |
Virtual I/O Cache write I/O rate |
|
|
Files Retained |
Number of Virtual I/O Cache files retained |
|
|
I/O WrtBypass/Sec |
Virtual I/O Cache writes bypassing rate - writes bypassing the cache/second |
|
|
I/O RdBypass/Sec |
Virtual I/O Cache reads bypassing rate - reads bypassing the cache/second |
|
|
Misses-Blksz LT 33 |
The number of read operations with a block size less than 33 that bypassed the eXtended File Cache for the current interval for the local node. |
|
|
Misses-Blksz 33-64 |
The number of read operations with a block size from 33 to 64 that bypassed the eXtended File Cache for the current interval for the local node. |
|
|
Misses-Blksz 65-127 |
The number of read operations with a block size from 65 to 127 that bypassed the eXtended File Cache for the current interval for the local node. |
|
|
Misses-Blksz 128-255 |
The number of read operations with a block size from 128 to 255 that bypassed the eXtended File Cache for the current interval for the local node. |
|
|
Misses-Blksz GT 255 |
The number of read operations with a block size greater than 255 that bypassed the eXtended File Cache for the current interval for the local node. |
|
|
Copyright © 2008 CA.
All rights reserved.
|
|