

Initially, when a limited amount of data has been collected, the baseline average is calculated for the same hour for every preceding day of the week. For example, after two days worth of history, a baseline average value for the 9:00 AM to 10:00 AM time period is calculated by averaging the hourly rollups for the same time periods for two consecutive days.
Eventually, when more data is available, a switchover in the calculation method occurs automatically and Data Aggregator establishes "normal" by averaging hourly samples across available preceding same days of the week. This method, then, takes into account the day of the week patterns in utilization. This method produces a better approximation of what is "normal", which can lead to a reduction in the number of missed violations and false positive events that are generated. In the same example as above, after three weeks of history, a baseline average is calculated by averaging the 9:00 AM to 10:00 AM hourly rollups for the three Mondays within the three-week period.
Note: By default, this automatic switchover occurs when at least three same day of the week, same hour data samples are available for the past 12 weeks. Data Aggregator switches back to the every day, same hour calculation method automatically when the required number of data points is no longer available. These default settings are configurable. For information about changing these default settings, see the Data Aggregator REST Web Services Guide.
Baseline averages are calculated for event and report generation purposes.
Example: Calculate the Same Hour Average and Population Standard Deviation for CPU Utilization
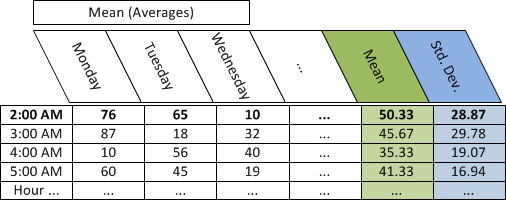
The following example shows how the "same hour" average (mean) and population standard deviation are calculated for CPU utilization on a specific device, when there are three points of data for 2:00 AM on Monday, Tuesday, and Wednesday.
Follow these steps:
Day: Monday Tuesday Wednesday
Mean (Average) CPU utilization: 76 65 10
The formula for calculating the population mean is as follows:
The population mean = sum of data point values in population/number of data points.
The equation for this example is as follows:
(76+65+10)/3
The population mean= 50.33
The differences for this example are:
25.67 14.67 -40.33
The squares for this example are:
658.78 215.11 1,626.778
The sum of the squares for this example is 2,500.67.
The result for this example is 833.56.
The square root for this example is 28.87.
The standard deviation for this example is 28.87.
The following table depicts the hourly averages (mean) of rate data by day, the average (mean) of hourly averages, and the population standard deviation of the hourly averages for the same hour:
Example: Calculate the Same Day of the Week Same Hour Average and Population Standard Deviation for CPU Utilization
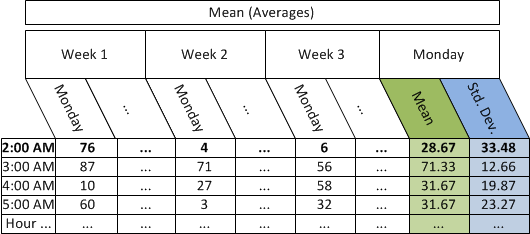
The following example shows how the average (mean) and population standard deviation are calculated for CPU utilization on a specific device, when there are three points of data for three Mondays at 2:00 AM.
Follow these steps:
Monday of Week: 1 2 3
Mean (Averages) CPU utilization: 76 4 6
The formula for calculating the population mean is as follows:
The population mean = sum of data point values in population/number of data points.
The equation for this example is as follows:
(76+4+6)/3
The population mean = 28.67.
The differences for this example are:
47.33 -24.67 -22.67
The squares for this example are:
2,240.44 608.44 513.78
The sum of the squares for this example is 3,362.67.
The result for this example is 1,120.89.
The square root for this example is 33.48.
The standard deviation for this example is 33.48.
The following table depicts the hourly averages (mean) of rate data by day, the average (mean) of hourly averages and the population standard deviation of the hourly averages for the same day of the week, same hour:
Example: Deviation from Normal using the Same Day of the Week Same Hour Average and Population Standard Deviation for CPU Utilization
Assume that Data Aggregator is polling CPU utilization data at a 5-minute interval. You define an event rule to generate an event when CPU utilization is greater than one standard deviation above the mean for a single 5-minute poll interval.
In this example, event rule duration and window are both set to 5 minutes.
The formula for calculating when an event is raised is as follows:
CPU utilization = mean value + 1(standard deviation value)
Therefore, substituting mean and standard deviation values from the preceding same day of the week, same hour for Monday at 2:00 AM is as follows:
CPU utilization = 28.67 + 1 (33.48)
CPU utilization = 62.15
As a result, if CPU utilization were to exceed 62.15 for a single 5-minute poll interval between 1:05 AM and 2:00 AM on Monday, an event would be raised. This event indicates that the CPU utilization deviated from normal for that timeframe.
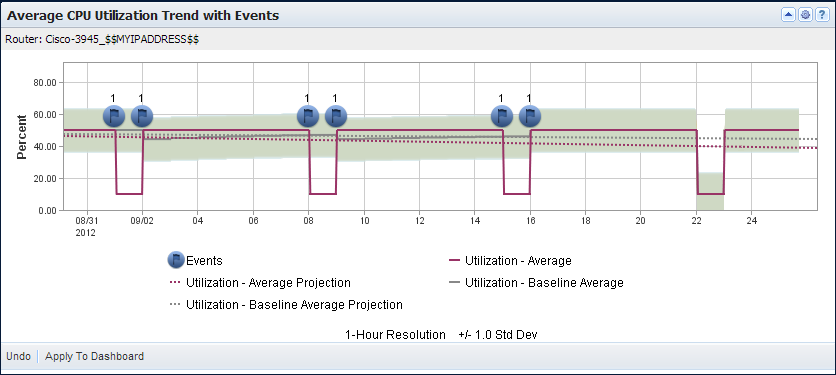
Example: Examine CPU Utilization Events in a Trend Chart View
Assume that Data Aggregator is polling CPU utilization data at a 5-minute interval. In this example, you want to be alerted whenever CPU utilization on one of your business critical servers drops below the expected level. You define an event rule to generate an event when CPU utilization is one standard deviation below the mean for a single 5-minute poll interval.
For illustrative purposes only, assume that CPU utilization is 50 percent from Monday, 12:00 AM to Sunday, 12:00 AM. From Sunday, 12:00 AM to Monday, 12:00 AM, CPU utilization drops to 10 percent. You expect this drop in utilization. However, when Data Aggregator begins to calculate the baseline average, an event is raised when the CPU utilization drops to 10 percent. The event clears when the CPU utilization goes back up to 50 percent. The erroneous event is raised because, initially, when a limited amount of data is collected, the baseline average is calculated for the same hour for every day, not taking into account the difference in utilization across days of the week. Data Aggregator is expecting the CPU utilization to be 50 percent always.
After three weeks pass, three same days of the week, same hour data samples are available, and the baseline average calculation method changes. Data Aggregator establishes "normal" by averaging hourly samples across same days of the week. Data Aggregator is now expecting the CPU utilization to be 10 percent every Sunday at 12:00 AM to Monday at 12:00 AM. The erroneous event that was raised previously every Sunday at 12:00 AM is no longer raised.
The following view demonstrates how initially, the baseline average is calculated for the same hour for every day. When more data is available, a switchover in the calculation method occurs automatically. Data Aggregator averages hourly samples across same days of the week.
This view also demonstrates erroneous events are no longer raised when the switchover in calculation occurs.
|
Copyright © 2015 CA Technologies.
All rights reserved.
|
|