Previous Topic: Managing the InfrastructureNext Topic: Monitoring Profiles


Customizing Device and Component Management Workflow

You can customize the management of your discovered devices and monitored components. Options include modifying profiles, modifying associations, creating new vendor certifications, and importing metric families. For example, you can poll critical interfaces more frequently or can apply custom monitoring profiles with event rules to custom device collections.

The following workflow offers a best practice to use as a quick reference for customization.

Log in as a user with the Administrator role and perform the following steps:

  1. Create new monitoring profiles (or make copies of factory monitoring profiles) to customize the poll rates and metrics for monitoring your devices.
  2. (Optional) Add event rules to custom monitoring profiles.
  3. (Optional) If the factory vendor certifications and their associated metric families do not meet your needs, create custom vendor certifications and import new metric families. This step can be done at any time.

    Note: For more information about custom metric families and custom vendor certifications, see the Data Aggregator Self-Certification Guide.

  4. Create custom device collections and associated rules in CA Performance Center, which are then used as Data Aggregator device collections. You can either synchronize these device collections with Data Aggregator immediately or wait for the automatic synchronization to occur. The population of devices into these device collections can be done manually after discovery.

    Note: If you are an MSP or a tenant, perform this step as the tenant administrator. For more information about creating monitored groups and synchronizing data sources, see the CA Performance Center Administrator Guide.

  5. Customize your monitoring profile and device collection associations to make sure that the poll rate you want is used. When you create a custom monitoring profile, associate the custom monitoring profile with a custom device collection to activate the monitoring profile and any related event rules.

    Note: If you are an MSP or a tenant, perform this step as the tenant administrator.

    Customization can also include removing associations between factory monitoring profiles and device collections, and associating custom monitoring profiles to either factory or custom device collections.

  6. Review the component monitoring results after polling with the new configuration has begun to verify that you are collecting the information that you want.

    Note: If you are an MSP or a tenant, perform this step as the tenant administrator.

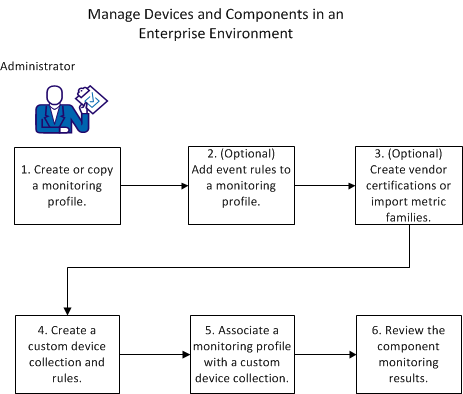
This diagram illustrates the workflow for an enterprise:

This workflow shows the process for managing an enterprise network.

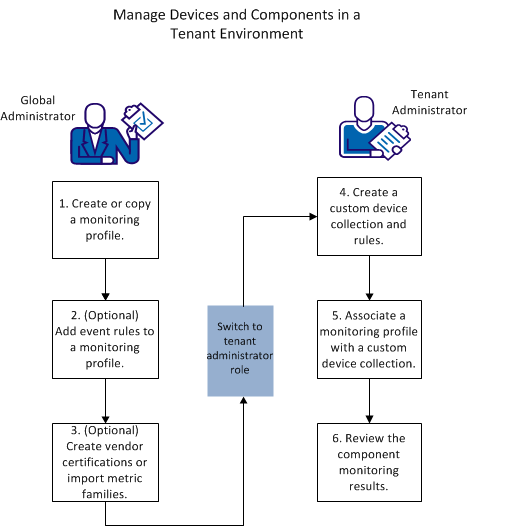
This diagram illustrates the workflow for a tenant environment:

This diagram shows the workflow to manage a tenant network.