

As the Administrator, you need frequent data about your most critical systems while maximizing the overall performance of your performance management systems. One way to accomplish your goal is by polling only critical interfaces at a high rate, while polling noncritical interfaces at a normal or slow rate. You can poll at differing rates by using a filter on the Interfaces metric family that is associated with your monitoring profile. By fast-polling interfaces sparingly, you can reduce unnecessary network traffic and performance management system load while still sufficiently monitoring the health of your network system.
For example, your data center access switch connects many application servers to only two aggregation switches. You decide to poll the interfaces supporting these aggregation switches at a higher rate. These links are critical, because they support network traffic to all other connected switches. However, polling all interfaces at a higher rate would cause unnecessary network traffic, wasting system resources and possibly causing network performance issues. After consulting with your network operations and engineering teams, you decide that a normal polling rate is sufficient for the interfaces connecting each attached server. To apply different polling rates, you implement two monitoring profiles for interfaces.
Note: Filters that you set on metric families are ignored when event rules that are applied to monitoring profiles trigger events.
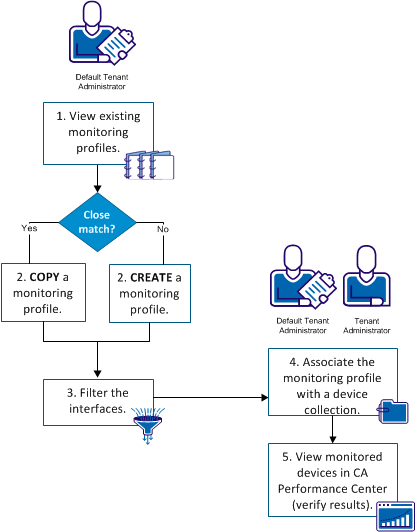
The following illustration shows how to configure monitoring profiles to poll interfaces at varying rates:
|
Procedures |
|---|
Note: For more information about how monitoring profiles work with device collections and metric families, see the Data Aggregator Overview Guide.
|
Copyright © 2015 CA Technologies.
All rights reserved.
|
|