

A built-in mechanism monitors the health of the Data Aggregator and the Data Collector devices. Self-monitoring monitoring profiles determine what statistics are discovered and polled for these devices. These statistics are collected automatically.
Important! We recommend that you do not change or stop this self-monitoring.
As an administrator, you want to monitor your Data Aggregator and Data Collector items so that you can manage their performances proactively and you can perform capacity planning.
In this scenario, you will view the monitoring profiles that are associated with Data Aggregator and Data Collector self-monitoring. You will also view the components that are being monitored on the Data Aggregator device. This information helps you to understand how the health of these items is managed.
You will also create dynamic trend views, where you can view changes that are occurring on Data Aggregator over time. This information is useful when you are troubleshooting performance issues and performing capacity planning.
The following diagram illustrates the process of reviewing health monitoring information for Data Aggregator and Data Collector:
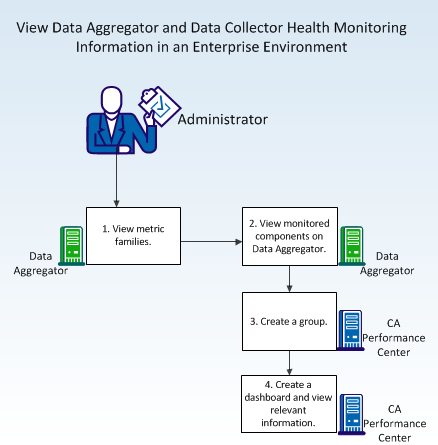
To view health monitoring information, follow these steps:
|
Copyright © 2015 CA Technologies.
All rights reserved.
|
|