

Dashboards display data from a particular polled item or group of polled items. (Item can be a device, component, or interface.) In this scenario, you want to display data about the state of the threshold monitoring engine.
By looking at this information, you can view changes that are occurring over time. To determine when significant changes are occurring on the threshold monitoring engine, use this information.
Follow these steps:
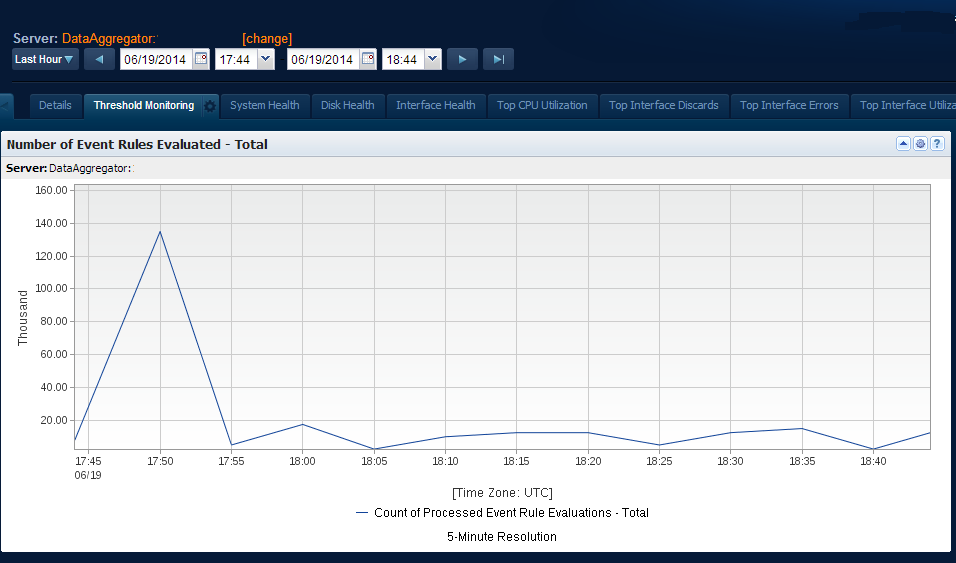
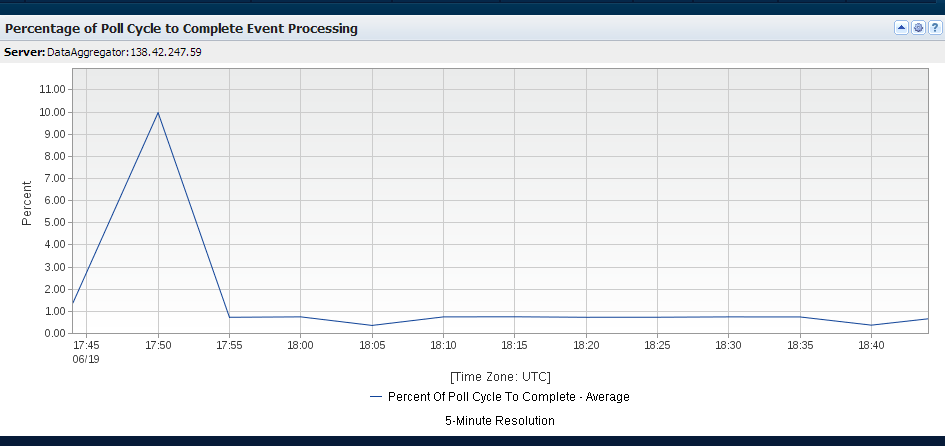
The "Number of Event Rules Evaluated - Total" and the "Percentage of Poll Cycle to Complete Event Processing" views are included in the dashboard.
The "Number of Event Rules Evaluated - Total" view displays the number of actual rule evaluations that have occurred for an associated set of polled items.
The "Percentage of Poll Cycle to Complete Event Processing" view displays the percentage of the poll cycle that the threshold monitoring engine takes to complete event processing.
You have successfully viewed the threshold monitoring dashboard to view information on the threshold monitoring engine load and how the engine is performing. In addition to the dashboard, you can also view events and receive event notifications that describe the status of the threshold monitoring engine. Next, you will view these events and notifications.
|
Copyright © 2015 CA Technologies.
All rights reserved.
|
|