

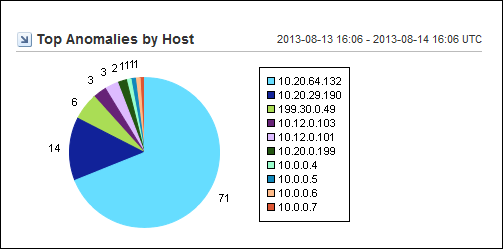
The Top Anomalies by Host pie chart shows the top anomalous hosts, ranked by the number of anomalies for the reporting time frame. A maximum of 10 hosts are included. The number of instances is shown next to each pie slice.
You can edit the following view settings:
This view is included by default on the Anomaly Detector page in the Performance Center Console. The example graphic shows the view as it appears in the CA Performance Center Console.
|
Copyright © 2015 CA Technologies.
All rights reserved.
|
|