

Reporting › Infrastructure Overview Dashboard › Interfaces Over Threshold
Interfaces Over Threshold
The Interfaces Over Threshold view in the Performance Center Console lists the most heavily used interfaces throughout the enterprise. A table summary shows the interfaces with utilization that exceeds the configured thresholds. The example graphic shows the view in the CA Performance Center Console.
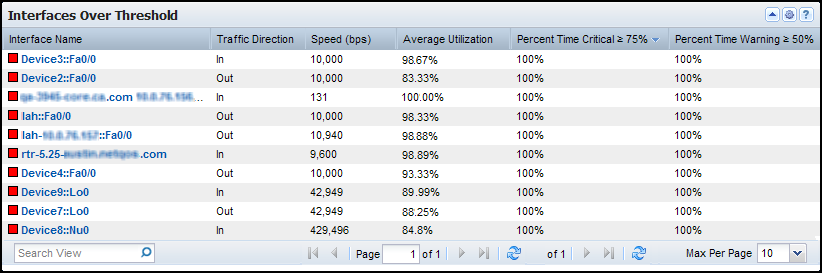
The Interfaces Over Threshold view shows the interfaces whose traffic exceeded the configured thresholds during the reporting period. The view includes the following information for up to ten top interfaces:
- Status
-
Identifies the interface status as Critical (Red - Meets or exceeds the user-defined Critical threshold) or Warning (Orange - Meets or exceeds the user-defined Warning threshold).
- Interface Name
-
Identifies the interface by its name. (Depending on the application setting for the name format, the name may be prefixed by the device name.)
- Traffic Direction
-
Shows whether the data was inbound or outbound on the interface.
- Speed
-
(CA PC) Records the data speed that is defined for the interface.
- Average Utilization
-
Measures the average percentage of interface capacity that was used.
- Percent Time Critical
-
Shows the percentage of the reporting period the interface met or exceeded the Critical threshold.
- Percent Time Warning
-
Shows the percentage of the reporting period the interface met or exceeded the Warning threshold.
Performance Center views show the data from the time range that is defined for the page.
Opening the View
To see this view in the Performance Center Console, go to one of the following locations:
- (CA PC) Infrastructure Overview dashboard; Summary context view in a custom dashboard
- (NPC) Enterprise, Traffic Analysis, Routers/Switches Overview, or custom dashboard
Available Actions
You can perform several actions in this view, including the following ones:
- Change the thresholds, view name, and utilization settings as described in this topic.
- (CA PC) Change the columns that are shown in the table: Click near a column border, click Columns, then choose the columns to display.
- Click an interface name to open the Interface context pages. You can review details or open additional views of interface data.
How to Change the View Settings
Follow these steps:
- Open the dialog for editing the view:
- (CA PC) Click the Edit icon
 in the view title bar and click Edit.
- (NPC) Click the arrow next to the title name and select Edit from the menu.
The dialog opens.
- (Optional) Edit the text in the Title field to change the name in the view title bar.
- (Optional) Edit the thresholds by changing any of the following values in the Interfaces Over Threshold Settings section:
- Critical - % Utilization: Specify the utilization percentage for flagging interfaces with a status of Critical, the highest level of concern. If the utilization for an interface has met or exceeded this percentage, it is marked with a red (Critical) status symbol.
- Warning - % Utilization: Specify the utilization percentage for flagging interfaces with a status of Warning. If the utilization for an interface has met or exceeded this percentage, but has not met the Critical threshold, the interface is marked with an orange (Warning) status symbol.
- Affected % of reporting period: Specify the percentage of the reporting period that a utilization percentage must be violated in order for the threshold to be met.
For example, if the ‘Affected % of reporting period’ value is 25, the threshold is met for the interfaces that have a utilization level at or above the threshold level during 25% of the reporting period. With the default reporting period of 24 hours, the list includes interfaces at or above the threshold value for six hours or more during the previous 24 hours.
- (Optional) (NPC) Define a new context to filter the interfaces that can appear in the view: Select the Filter by value and select a context type and setting in the Select Context dialog.
Interfaces that are not in the selected group do not appear in the view, even if they violate a threshold. If you select a group, the defined context appears under the view title.
- (Optional) Specify which users are affected by the settings: Select a value from the Apply Changes list:
- For All Tenant Users: Saves the changes so that they are only available to users associated with your tenant (possibly the Default Tenant).
- My User Account: Saves the changes to your user account as a default for this view.
- My Current Session: Reverts the changes when you log out.
- Click Save to save your changes, Cancel to exit without saving changes, or Use Defaults to restore the default values.
The dialog closes and the view reflects your changes.
Find the Comparable View in the NFA Console
The Interfaces Over Threshold view in the Performance Center Console is similar to the Interface Utilization view on the Enterprise Overview page in the NFA console.
Copyright © 2015 CA Technologies.
All rights reserved.
|
|