

Reporting › CA Network Flow Analysis Views in CA Performance Center › Calendar Chart (Flow)
Calendar Chart (Flow)
The Calendar Heat Chart (Flow) view maps the utilization percentage of the selected interface over time. The example graphic shows the view in the CA Performance Center Console.
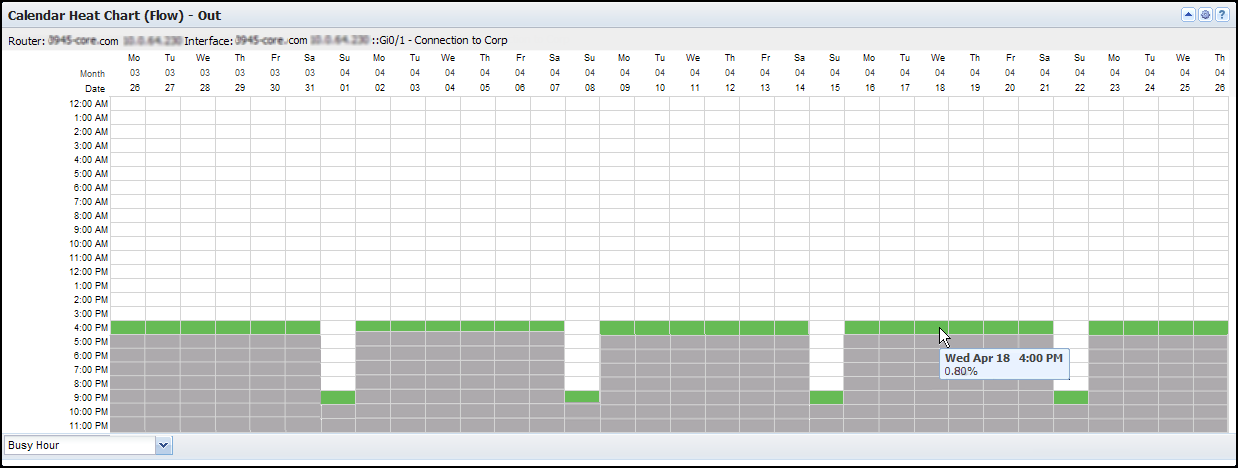
This view makes it easy to detect recurring data patterns. Finding a pattern can help you identify the source of high traffic rates and potential performance issues. You might discover that the high traffic rates you thought were intermittent actually follow a pattern. The view can show the hour of each day when utilization is the highest, for example.
Each color represents a severity range that is calculated as a percentage of total capacity. High utilization is shown in orange and red. Low utilization is shown in green and blue.
The view includes the following information:
- Identifier
-
Consists of the router name, interface name, and interface description (under the view title). The interface description consists of the ifDescr value by default, so it may be slightly different than the interface description that is shown in the NFA console.
(NPC) The identifier line also includes the interface speed.
- Month, Date, and Day of the Week
-
Denote the day that the traffic occurred (X-Axis columns).
- Hour
-
Denotes the hour of the day that the traffic occurred (Y-Axis).
Opening the View
To see the Calendar Heat Chart view in the Performance Center Console, add it to a custom dashboard.
Opening the View
To see this view in the Performance Center Console, go to one of the following locations:
- (CA PC) Custom dashboard
- (NPC) Interface Pages (with an interface selected): Custom tab
Available Actions
You can perform several actions in this view, including the following ones:
- Change the data direction and view name as described in this topic.
- (CA PC) Display details in a Tooltip by holding your cursor over a cell.
- (CA PC) Click Show All and choose a pattern-matching filter. For example, select Busy Hour to show only the data for the busiest hour of each day.
How to Change the View Settings
Follow these steps:
- Open the dialog for editing the view:
- (CA PC) Click the Edit icon
 in the view title bar and click Edit.
- (NPC) Click the arrow next to the title name and select Edit from the menu.
The dialog opens.
- (Optional) Edit any of the following settings in the Calendar Heat Chart (Flow) Settings section:
- Title: Change the name that appears in the view title bar.
- (CA PC) Time Display Format: Select the time format for the chart, either 12 hours or 24 hours.
- (CA PC) Zone Start: Set the starting value of each heat zone. The defaults are based on IT industry standards for performance. For example, the default Red Zone Start value is 70 percent utilization.
Defaults: Green Zone Start = 0, Yellow Zone Start = 50, Orange Zone Start = 60, Red Zone Start = 70.
- (CA PC) Business Week Start: Select the day that starts the business week.
Default: Monday.
- (CA PC) Direction Settings: Select the direction of traffic on the selected interface to include in the report:
- Out: Outbound on the interface.
- In: Inbound on the interface.
- Total: Combination of inbound and outbound traffic.
- (Optional) (CA PC) Change the context for the view data: Select a different interface from the Context Settings table.
- (Optional) Specify which users are affected by the setting changes: Select a value from the Apply Changes list:
- Default for All Users: Saves the changes to all user accounts as a default for this view.
- For All Tenant Users: Saves the changes so that they are only available to users associated with your tenant.
- My User Account: Saves the changes to your user account as a default for this view.
- My Current Session: Reverts the changes when you log out.
- Click Save to save your changes.
The settings dialog closes. The view refreshes to reflect your updates.
Find the Comparable View in the NFA Console
To display Calendar Chart data for an interface in the NFA console, select an interface on the Interface page and select the following options:
- Report type: Utilization.
- Presentation menu option: Direction In or Direction Out.
To display Flow Forensics-level detail, click the Flow Forensics link and run a Flow Forensics report.
Copyright © 2015 CA Technologies.
All rights reserved.
|
|