

The ToS Summary (Pie) view shows an overview of the Type of Service (ToS) values for traffic on the selected interface. The example graphic shows the view in the CA Performance Center Console.
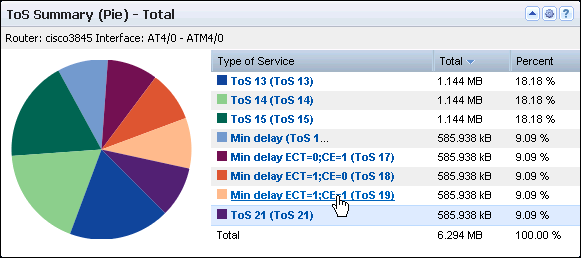
The view includes a pie chart and table of information about the high-volume ToS values in use on the selected interface. The table includes the following information by default:
Identifies the interface that is used for the report. The identifier string consists of the router name, interface name, and interface description (under the view title).
(NPC) The identifier line also includes the interface speed.
Name of the ToS values associated with high-volume traffic, identified by number and label.
Shows the total data volume for the reporting period.
(CA PC) Lists the percentage of the total data volume for the Top N ToS.
Performance Center views show the data from the time range that is defined for the page.
Opening the Views
To see these views in the Performance Center Console, go to one of the following locations:
Available Actions
You can perform several actions in this view, including the following ones:
Find ToS Summary Pie Charts in the NFA Console
You can display pie charts of ToS summary data in the NFA console for a selected interface:
View: ToS Summary (In and Out) for the Top N ToS.
View: ToS Summary (In, Out, and Total) for the Top N ToS.
Views: ToS Protocol Summary (In and Out) for the single ToS; ToS Hosts Summary (From and To) for the single ToS; ToS Conversations Summary (Total) for the single ToS.
Note: You can view additional versions of the summary pie charts by selecting Protocols, Hosts, or Conversations as the report subtype.
To display Flow Forensics-level detail, click the Flow Forensics link and run a Flow Forensics report.
|
Copyright © 2014 CA.
All rights reserved.
|
|