

The Top Conversations (Bar) views show the top 10 conversations that consume bandwidth for an interface. A bar graph shows the bandwidth consumption for each conversation.
For example, use conversation information to determine the IP addresses of high-volume hosts. Contact the host owners or users to investigate the nature and purpose of the traffic.
You can view the conversations for incoming data, outgoing data, or all data--as shown in the example graphic.
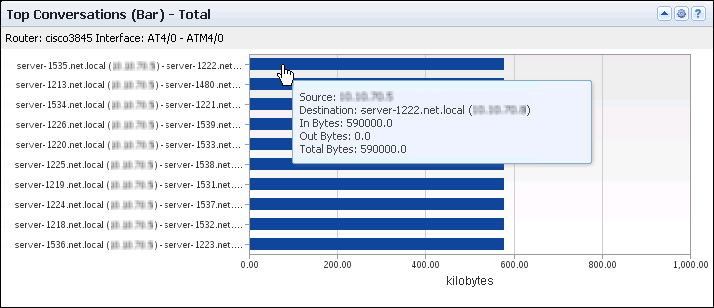
The view includes a bar for each top conversation on the selected interface. An identifier near the top shows the router and interface whose data are displayed. The bar chart includes the following information:
Identifies the conversation source and destination servers by their names (the fully qualified DNS names, if they are available), followed by the IP addresses (Y-Axis).
Measures the total amount of data that was exchanged in the conversation (for example, in number of kilobytes) (X-Axis).
By default, views and reports show the most recent 24 hours of data.
To see a Top Conversations (Bar) view in CA Performance Center, add it to a custom dashboard.
Available Actions for This View
You can perform several actions in this view, including the following actions:
Find Conversation Data in NFA Console Views and Reports
You can display conversation volume trend charts in the NFA console for any interface you have selected:
View: Conversations Multi Trend Summary (Total) for the Top N Conversations, plus other views.
View: Conversations Trend for the Top N Conversations.
View: Protocol Conversations Summary (Total) for a single protocol.
View: ToS Trend view for each conversation that uses the single ToS.
Note: To see trend charts for a single conversation, click Top N Conversations and select a single conversation as the filter.
To display Flow Forensics-level detail, click the Flow Forensics link and run a Flow Forensics report.
|
Copyright © 2013 CA.
All rights reserved.
|
|