

The ToS Summary (Pie) view shows an overview of the Type of Service (ToS) values for traffic on the selected interface.
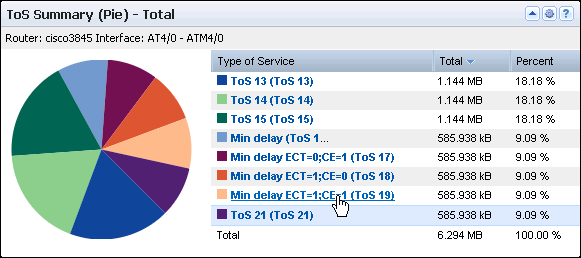
The view includes a pie chart and table of information about the high-volume ToS values in use on the selected interface. An identifier near the view top shows the interface whose data is displayed. The table includes the following information by default:
Identifies the interface that is used for the report. The identifier string consists of the router name, interface name, and interface description (under the view title). The interface description consists of the ifDescr value by default, so it may be slightly different than the interface description that is shown in CA Network Flow Analysis.
Name of the ToS values associated with high-volume traffic, identified by number and label.
Shows the total data volume for the reporting period.
Lists the percentage of the total data volume for the Top N ToS.
By default, views and reports show the most recent 24 hours of data.
To see a ToS Summary (Pie) views in CA Performance Center, go to one of the following locations:
Available Actions for This View
You can perform several actions in this view, including the following actions:
Find ToS Summary Pie Charts in the NFA Console
You can display pie charts of ToS summary data in the NFA console for a selected interface:
View: ToS Summary (In and Out) for the Top N ToS.
View: ToS Summary (In, Out, and Total) for the Top N ToS.
Views: ToS Protocol Summary (In and Out) for the single ToS; ToS Hosts Summary (From and To) for the single ToS; ToS Conversations Summary (Total) for the single ToS.
Note: You can view additional versions of the summary pie charts by selecting Protocols, Hosts, or Conversations as the report subtype.
To display Flow Forensics-level detail, click the Flow Forensics link and run a Flow Forensics report.
|
Copyright © 2013 CA.
All rights reserved.
|
|