

|
|
|
The Top Hosts (Bar) views show the top 10 hosts that consume bandwidth for a particular interface. A bar graph shows the bandwidth consumption for each host.
You can use this information in troubleshooting to determine the IP addresses of hosts that are responsible for high volumes of traffic. You can then contact the owner or user of each host to investigate the nature and purpose of the traffic.
You can view the hosts for incoming flows, for outgoing flows, or for all flows--as shown in the example graphic.
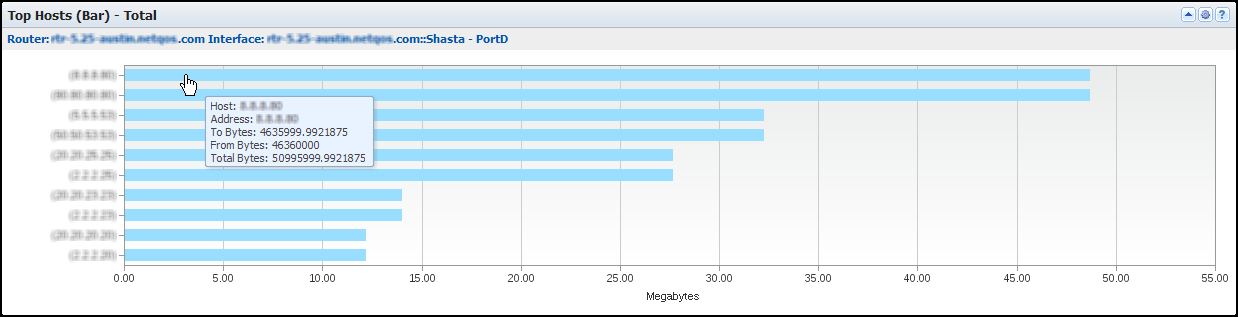
The view includes a bar for each high-volume host on the selected interface. A text string near the top of the view identifies the interface whose data is displayed. The bar chart includes the following information:
Identifies the host server by its name or IP address (Y-Axis). If an administrator defined an alias for the device item, the alias is displayed. Otherwise, the discovered device name is displayed.
Measures the total amount of data that was exchanged between the host and the interface (for example, in number of megabytes) (X-Axis).
By default, views and reports show the most recent 24 hours of data.
To see a Top Hosts (Bar) views in CA Performance Center, add it to a custom dashboard.
Available Actions for This View
You can perform several actions in this view, including the ones in the following list:
Find Host Trend Views in the NFA Console
The Enterprise Overview page in the NFA console displays traffic volume for the top hosts in a bar chart.
You also can display host volume in trend charts for any interface that you have selected:
View: Hosts Multi Trend Summary (From and To) for the Top N Hosts, plus other overview views.
View: Host Trend for each of the Top N Hosts.
Note: To see trend charts for a single host, click Top N Hosts and select a single host as the filter.
To display Flow Forensics-level detail, click the Flow Forensics link and run a Flow Forensics report.
| Copyright © 2012 CA. All rights reserved. |
|