
")
|
|
|
The Top Hosts (Pie) views include pie charts that show the Top IP hosts that account for the highest volumes of IP traffic on the selected interface.
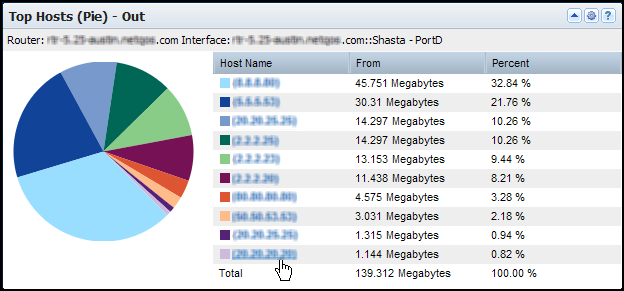
The view includes a pie chart and table of information about the high-volume hosts on the selected interface. A text string near the top of the view identifies the interface whose data is displayed. The table includes the following information by default:
Identifies the host server by its name or IP address. If an administrator defined an alias for the device item, the alias is displayed. Otherwise, the discovered device name is displayed.
Records the total amount of data that was exchanged between the host and the interface (for example, in number of megabytes).
Records the percentage of the total network traffic for the displayed hosts that is associated with the particular host.
By default, views and reports show the most recent 24 hours of data.
To see a Top Hosts (Pie) views in CA Performance Center, go to one of the following locations:
Available Actions for This View
You can perform several actions in this view, including the ones in the following list:
Find Host Pie Charts in the NFA Console
You can display pie charts with host volumes in the NFA console for any interface that you have selected:
View: Host Summary (From and To) for the Top N Hosts, plus other overview views.
View: Host Summary (From, To, and Total) for the Top N Hosts.
View: Protocol Hosts Summary (From, To, and Total) for the single protocol.
To display Flow Forensics-level detail, click the Flow Forensics link and run a Flow Forensics report.
| Copyright © 2012 CA. All rights reserved. |
|