

View the System Status page at any time to check the overall status of CA Network Flow Analysis components.
Follow these steps:
or
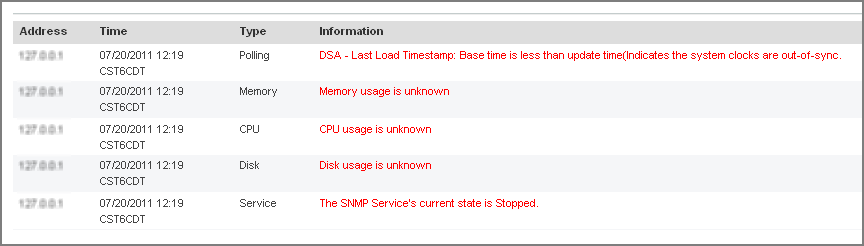
The System Status page opens and shows a quick overview of the status of CA Network Flow Analysis components. Status symbols identify any components that have generated warnings. The number of warnings appears in parentheses after the component label.
A table of warnings appears.
You can configure a wide range of settings on the Application Settings page.
Follow these steps:
The System Status page opens.
The Application Settings page opens.
Specifies how long the program waits before it flags an interface as inactive, starting from the Last Flow value on the Available Interfaces page. When the limit is reached, the interface status changes in the following locations:
Default: 4 Hours
Specifies the target port for TCP traffic that is redirected by an application mapping rule. TCP traffic that you do not want to go to a target port goes to the TCP Rebase Port instead. Other settings that affect application mapping behavior are UDP Rebase Port, ToS Mask, and Preserve ToS Map Proto. For more information, see the topics under Set Up Application Mapping.
Default: 9000
Specifies the number of bits that application mapping rules use for matching ToS values. The default value of 255 sets the program to look for matches throughout all ToS values. Other settings that affect application mapping behavior are TCP Rebase Port, UDP Rebase Port, and Preserve ToS Map Proto. For more information, see the topics under Set Up Application Mapping.
Default: 255
Specifies the target port for UDP traffic that is redirected by an application mapping rule. UDP traffic that you do not want to go to a target port goes to the UDP Rebase Port instead. Other settings that affect application mapping behavior are TCP Rebase Port, ToS Mask, and Preserve ToS Map Proto. For more information, see the topics under Set Up Application Mapping.
Default: 8000
Specifies whether newly discovered interfaces are enabled automatically (True) or are disabled (False). If you want to control which interfaces are reported and consume licenses, you may want to set the value to False. In this case you enable the interfaces manually on the Available Interfaces page. This setting affects the Enabled status for new interfaces. Interfaces that have already been discovered are not affected by changes to this setting.
Default: True
Sets the time zone for running Custom and Analysis reports. For example, a Custom report that has a reporting period of 1 day marks the start and end of the day according to the Default Time Zone. The time zone of the operator who runs the report is not used.
Default: GMT
Removes the specified suffixes from host names in NFA console views and reports. If you include .my_company.com, for example, this suffix is not shown in the host names that appear in any views or reports. To specify multiple entries, separate the entries with commas and without intervening spaces.
Default: <no default>
Specifies whether trendline reports show data with interconnecting lines.
If the value is True, trend lines connect data points in reports such as the Multi Trend Summary and Stacked Trend on the Interface pages. Fill pattern is shown beneath the lines.
If the value is False, the reports show only the data points that are real. The trend line ends at the last data point and starts at the next data point. The reports show gaps wherever data points are missing. The reports do not have boundary lines for fill pattern, so the fill pattern is missing.
Default: False
Specifies the email address of the NFA Administrator, which is used as the From value when reports are emailed. If this setting is not configured properly, users cannot send scheduled or on-the-fly reports. These functions also require a properly configured SMTP Server value.
Default: <no default>
Specifies the IP address of the SMTP mail server that is used for emailing reports. If this setting is not configured properly, users cannot send scheduled or on-the-fly reports. These functions also require a properly configured From Address value.
Default: <no default>
Records the total number of licenses that you purchased from CA. This value is used to calculate the percentage of licenses in use, which is displayed on the About page. The License Utilization percentage is accurate only if the Licensed Devices value is accurate.
Default: 50
Specifies whether protocol traffic for ToS-based application-mapped data is combined (N) or is shown as separate data streams that are labeled with the original protocol designators (Y).
For example, suppose the value is Y and you map TCP, UDP, and some other IP protocol traffic to one port. To continue the example, suppose you drill in to a link in the Enterprise Overview: Top Host view for a host that has the mapped data. In this case the Stacked Protocol Trend and Protocol Trend views show and label the protocol traffic separately--whether the protocol traffic is for TCP, UDP, or some other IP protocol.*
If the Preserve ToS Map Proto value is N and the Stacked Protocol Trend views show related protocol traffic, all of the protocols for the mapped traffic are combined in a single traffic stream that has a TCP label.
* Stacked Protocol Trend and Protocol Trend views show protocol traffic that meets the following conditions: (1) The traffic passes the minimum threshold and (2) The protocol volume is high enough to place it in the Top N group.
Other settings that affect application mapping are TCP Rebase Port, UDP Rebase Port, and ToS Mask. For more information, see the topics under Set Up Application Mapping.
Default: Y
Specifies whether interface views and reports include (True) or hide (False) broadcast/multicast traffic.
Default: True
Specifies the IP address of the NFA console. The DSA in a 3-tier distributed deployment uses this IP address to contact the NFA console. If the setting is incorrect, the DSA cannot retrieve data files and your reports cannot display 15-minute data.
Default:
Specifies the number of seconds between checks to see if reports have finished running. The status Complete is displayed when both of the following conditions are met:
Default: 15
Removes the specified suffixes from router names that appear in the NFA console views and reports. To specify multiple entries, separate the entries with commas and without intervening spaces.
Default: <no default>
Specifies whether to include interface aggregations in Enterprise Overview page views. If the value is True, interface aggregations are included in the views.* To be included in Enterprise Overview page views, the aggregations must have enough traffic to pass the minimum thresholds and to rank in the Top N group.
Default: False
Specifies whether the interface name format starts with the device name (True) or omits it (False). This setting affects the interface names that appear in views and reports, such as the Enterprise Overview views, Interface page reports, and Custom Report Interface Summaries. For more information, see Change the Application Setting for Interface Names.
Default: True
Displays (True) or hides (False) the Notes icon for interface rows on the Active Interfaces page. If the Notes icon is visible, you can click it to add, edit, or view additional information about an interface, as described in Active Interfaces: Interface Information.
Default: False
IP address or DNS name of the target server for sending the traps that are shown as events in the Performance Center Console--on the Events Display page (CA PC) or the Event List page (NPC). Traps can be displayed as events only when this setting is configured correctly. Set the Trap Destination value to match the IP address of one of the following servers:
For more information, see Configure Trap Destinations.
Default: IP address of the NFA console (distributed deployment) or stand-alone server (stand-alone deployment)
|
Copyright © 2015 CA Technologies.
All rights reserved.
|
|