

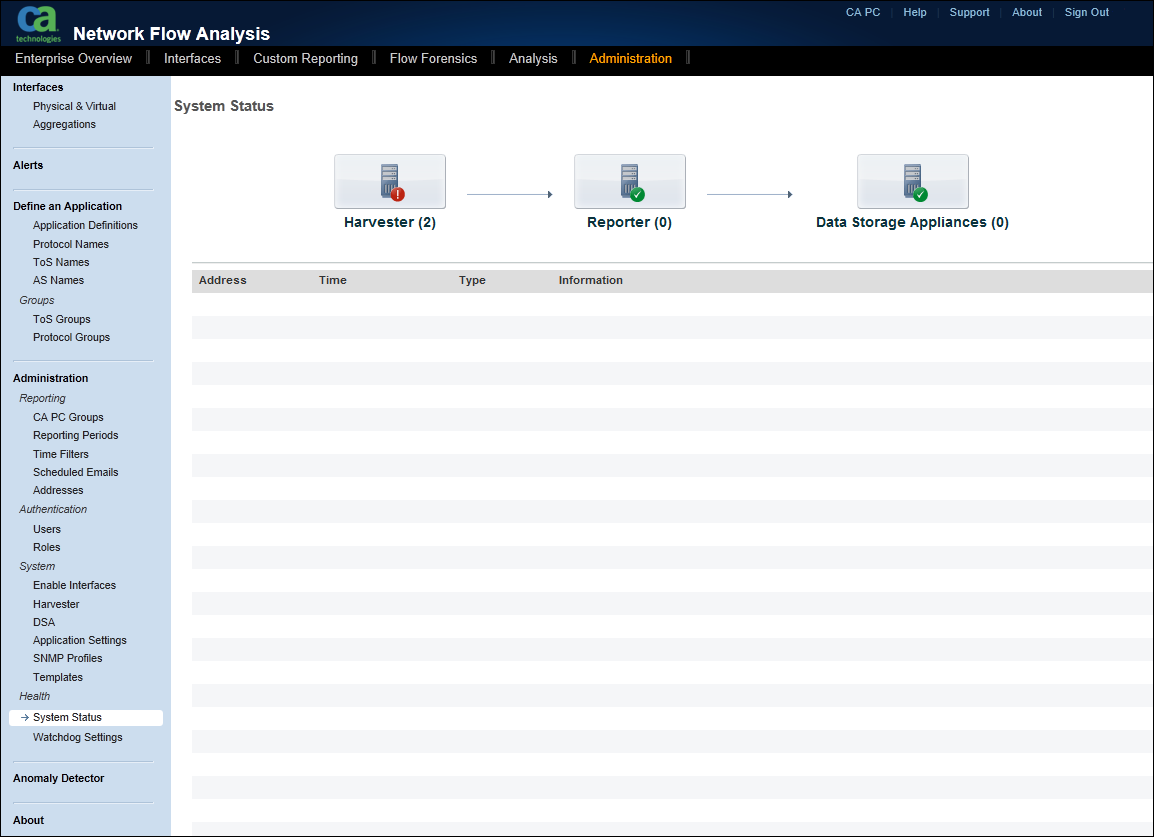
The CA Network Flow Analysis Administration page lets you review, administer, and customize the network data view. When you open this page, the System Status is displayed. The System Status uses the following status icons:
Click a red exclamation mark to view the associated error report. The error report includes the IP address, the type of component, and more information about the error. No error messages are displayed for a green check mark.
Notes:
The example graphic shows an NFA console in a three-tier distributed deployment that is registered as a data source for CA Performance Center.
Administration Landing Page
A menu of administrative options is on the left side of the page. The following list describes the pages and functions that correspond to the options.
View the status of the interfaces on the Active Interfaces page. You can also edit, delete, or merge interfaces or create and edit custom virtual interfaces (CVIs).
Aggregate interfaces on the Interface Aggregations page. Interface aggregations let you view and report on interfaces as a unified group.
Review, add, edit, and delete traps on the Trap Configuration page.
Create and edit rules for application mapping, port priorities, or Reserved Seating on the Application Definitions page.
Use the Protocol Configuration page to edit protocol names and descriptions. In a deployment that has multiple domains, protocol names are domain-specific.
Use the ToS Configuration page to edit a ToS label (description) in the context of a particular domain. You also can add, remove, or edit groups of ToS values. In a deployment that has multiple domains, ToS names are domain-specific.
Use the AS Names page to search and edit Autonomous System names in the context of a particular domain. In a deployment that has multiple domains, AS names are domain-specific.
Review, add, delete, or edit ToS groups on the ToS Group Configuration page.
Review, add, delete, or edit protocol groups on the Protocol Group Configuration page.
Open the Manage Groups page in the Performance Center Console. Review system groups and add, remove, or edit custom groups and site groups. This option is enabled if CA Network Flow Analysis is registered as a data source for Performance Center.
Use the Reporting Periods Configuration page to add, edit, and delete reporting periods. Operators can use the reporting periods to limit the time frames for the data in Interface reports.
View, add, edit, and delete time filters on the Time Filter Configuration page.
Use the Scheduled Emails page to review the reports that are scheduled for email delivery. You can change the destination address, Subject line, accompanying message text, and schedule options.
Use the Address-Hostname Configuration page to specify a mask and options for resolving IP addresses to DNS names. You can list, edit, delete, and expire IP addresses. Expiring IP addresses schedules them to be refreshed. In a deployment that has multiple domains, address configuration is domain-specific.
Open the page for managing user accounts in the Performance Center Console. Review the user accounts and their settings. Add, remove, and edit user accounts. This option is enabled if the product is registered as a data source for Performance Center.
Open the page to manage roles in the Performance Center Console. Review the existing role names and the capabilities and menus that are available for each role. Add, delete, and edit roles. This option is enabled if the product is registered as a data source for Performance Center.
View the router list and status of routers on the Available Interfaces page. Enable, disable, or delete interfaces on this page.
Use the Harvester page to view, add, edit, and delete the Harvesters that generate report data.
 DSA
DSAThree-tier architecture deployments only: Use the DSA page to add a DSA to your configuration or edit the DSA IP address. In a three-tier architecture deployment, one or more DSAs store the 15-minute (historical) data for reports.
Edit a wide range of application settings on the Application Settings page.
Open the page to manage SNMP profiles in the Performance Center Console. View, add, edit, delete, and re-order the SNMP profiles that Harvesters use for polling. In a multi-tenant environment, a Harvester uses the SNMP profiles that are assigned to its tenant. This option is enabled if the product is registered as a data source for Performance Center.
Use the Interface Templates page to view, add, edit, and delete the templates that determine the way interface names and descriptions are displayed.
View the overall status of the CA Network Flow Analysis components on the System Status page. Click a warning icon to display a list of the problem reports for the component.
Data Storage Appliances (DSAs) status is useful only for three-tier architecture deployments. DSAs are not included in two-tier deployments. In a two-tier deployment, the DSA status always shows a green system status icon.
View and edit the Watchdog configuration settings on the Watchdog Settings page.
Display the Anomaly Detector window to perform administrative functions for CA Anomaly Detector. These functions have been added to the NFA console to accommodate users in a deployment that includes CA Performance Center.
Notes:
For a CA NetQoS Performance Center deployment, we recommend that you use the functions in the CA NetQoS Performance Center Console. Working in a single location helps to reduce the possibility of multiple users writing to the database simultaneously. If that happens, unexpected results can occur.
The Anomaly Detector window gives you access to the following tabs:
The other page functions are enabled as soon as you add an instance of CA Network Flow Analysis to be monitored.
For more information about the functions, see the CA Anomaly Detector Guide.
Display the Version Information page to view the product version number and installation date. This page also contains links to the product version history, the Administrator Guide, and the Operator Guide.
|
Copyright © 2014 CA.
All rights reserved.
|
|