

The ToS Summary (Table) views show rate, volume, or utilization for the top ToS values of the traffic on a particular interface. You can use this information to compare traffic for each of the top ToS values.
The example graphic shows the view in the CA Performance Center Console. The table shows the rate for each listed ToS value. You can configure the view to display rate, utilization, or volume information.
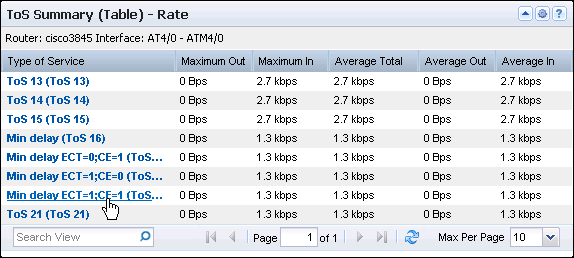
An interface identification string is shown under the view title. The table contains a row for each ToS with the Type of Service identifier (EF/AF, DSCP, and ToS values) and the following rate, volume, or utilization information:
The rate is calculated by dividing the data volume by the elapsed transmission time.
The utilization percentage is calculated by dividing the data rate by the data speed.
Performance Center views show the data from the time range that is defined for the page.
Opening the View
To see this view in the Performance Center Console, go to one of the following locations:
Available Actions
You can perform several actions in this view, including the following ones:
Find ToS Summary Tables in the NFA Console
You can display ToS summary tables in the NFA console for a selected interface:
View: ToS Summary Table for the Top N ToS.
Views: ToS Protocol Summary Table for the single ToS.
Views: ToS Hosts Summary Table for the single ToS.
Views: ToS Conversations Summary Table for the single ToS.
To display Flow Forensics-level detail, click the Flow Forensics link and run a Flow Forensics report.
|
Copyright © 2014 CA.
All rights reserved.
|
|