

Host data views are displayed as summary views (pie chart or summary table) by default. You can view individual trend plots for each of the hosts on the selected interface. To view individual trend plots, select the Trend Chart display type in the Presentation options for the Top-N Hosts report.
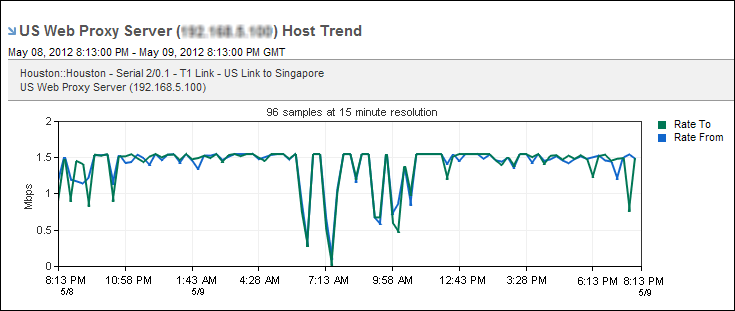
Host trend charts plot a line for each direction of the host traffic on the interface.
|
Copyright © 2013 CA.
All rights reserved.
|
|