

A Top N AS report provides AS (Autonomous System) Next Hop data, which provides high-level summaries of total volume and rate statistics for each AS number on a particular interface. This type of reporting is not used primarily for troubleshooting, but it is valuable for managing network routes efficiently. This insight helps service providers control costs by comparing traffic usage through transit networks versus traffic through networks with peer agreements.
To display a Top N AS Numbers report, start from an interface report.
Follow these steps:
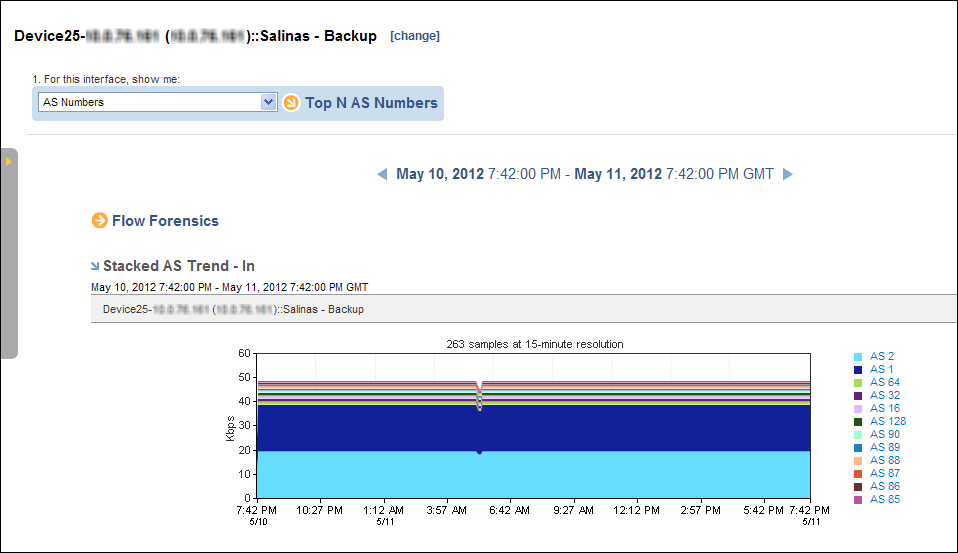
The report page is updated to show AS trend charts by default. The report includes AS Numbers data views for each of the following metrics:
Each option displays views of data that is inbound (In) and outbound (Out) with respect to the interface and data that is coming from (From) the previous hop and going to (To) the next hop.
The reporting period is the most recent 24-hour period by default.
|
Copyright © 2013 CA.
All rights reserved.
|
|