The Top Protocols (Table) views show rate, volume, or utilization for the top 10 highest-volume IP protocols for traffic on a particular interface. A table shows data for the protocols--and therefore, the applications--that account for the most traffic on the selected interface. For example, use this information to compare the amounts of data or level of utilization for particular applications on the interface.
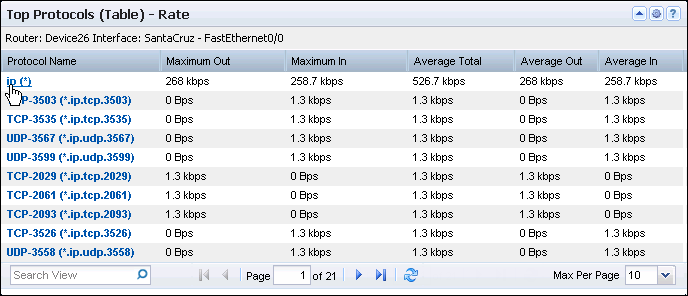
The example graphic shows a Top Protocols (Table) view that is set to show the volume of flow for each listed protocol. You can configure the view to display rate, utilization, or volume information.
The view contains an interface identification string and a table. The table contains a row for each protocol with the protocol name (keyword and TCP/UDP port assignment) and the following rate, volume, or utilization information (by default):
By default, views and reports show the most recent 24 hours of data.
To see a Top Protocols (Table) view in CA Performance Center, add it to a custom dashboard.
Available Actions for This View
You can perform several actions in this view, including the following actions:
Find Protocol Tables in the NFA Console
You can display tables of protocol volume data in the NFA console for a selected interface:
View: Protocol Summary Table for the Top N Protocols, plus other overview views.
View: Host Protocol Summary Table for the single host.
View: Conversation Protocol Summary Table for the single conversation.
To display Flow Forensics-level detail, click the Flow Forensics link and run a Flow Forensics report.
| Copyright © 2013 CA. All rights reserved. |
|