

The Enterprise-Wide Anomalies view is a comprehensive summary of the anomalous behavior during the reporting time frame, with details about the anomaly type, location, and size.
This view is useful for beginning an investigation of problematic network behavior or for initiating troubleshooting procedures to stem an attack. The Enterprise-Wide Anomalies view provides more detailed information about the anomalies you see in other views. This view also identifies the network locations to begin investigating.
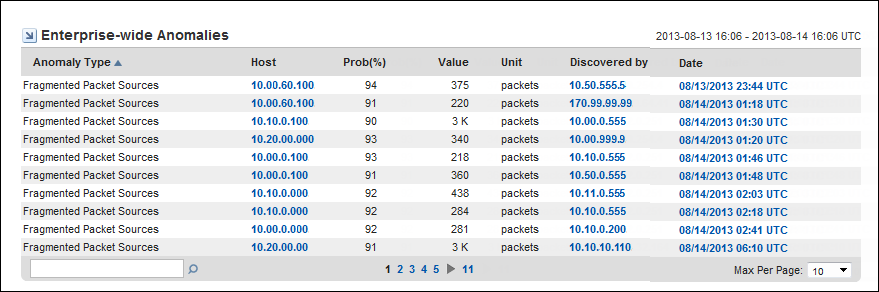
The Enterprise-Wide Anomalies view provides the following information about anomalous network behavior:
The type of anomalous behavior detected. For a description of each anomaly type that you can enable for monitoring, see Sensors Overview.
The name or IP address of the host on which the anomalous behavior is detected. The host may be a client system, a server, a router, or a router interface. The program attempts to resolve the hostname of any IP address and displays that name in this field.
The calculated likelihood that flagged packet flows are truly anomalous.
Probability is expressed as a percent. For example, if the probability for an anomaly type is 91%, the packet flows that triggered the anomalous behavior report are calculated to have a 91% probability of being anomalous. In this case, the packet flows have a low probability of occurring normally on this network.
For more information about how the probability algorithm operates, see Probability Thresholds.
The value that triggered the anomalous behavior report, expressed in the units of measure shown in the Unit column. For example, the number of gigabytes of data in the anomalous flow.
The unit of measurement that is used to express the Value, such as packets, flows, or destination hosts (dest hosts).
The router, interface, or data source that detected the anomalous data.
The date and time that the anomalous behavior is detected. The time may vary by up to 15 minutes from the time when the flows actually took place. Data is pulled from the Harvesters for analysis at 15-minute polling intervals.
|
Copyright © 2013 CA.
All rights reserved.
|
|